10-K: Annual report [Section 13 and 15(d), not S-K Item 405]
Published on February 27, 2025
UNITED STATES
SECURITIES AND EXCHANGE COMMISSION
Washington, D.C. 20549
FORM 10-K
(Mark One)
ANNUAL REPORT PURSUANT TO SECTION 13 OR 15(d) OF THE SECURITIES EXCHANGE ACT OF 1934 |
|||||
For the fiscal year ended December 31 , 2024
OR
TRANSITION REPORT PURSUANT TO SECTION 13 OR 15(d) OF THE SECURITIES EXCHANGE ACT OF 1934 |
|||||
For the transition period from ______ to ______
Commission file number 001-42111
___________________________
(Exact name of registrant as specified in its charter)
___________________________
(State or other jurisdiction of incorporation or organization) |
(I.R.S. Employer Identification No.) |
||||
(Address of Principal Executive Offices) |
(Zip Code) |
||||
(212 ) 970-0269
Registrant’s telephone number, including area code
Securities registered pursuant to Section 12(b) of the Act:
Title of each class |
Trading Symbol(s) |
Name of each exchange on which registered |
||||||
Securities registered pursuant to section 12(g) of the Act: None
Indicate by check mark if the registrant is a well-known seasoned issuer, as defined in Rule 405 of the Securities Act. Yes o No x
Indicate by check mark if the registrant is not required to file reports pursuant to Section 13 or 15(d) of the Securities Act. Yes o No x
Indicate by check mark whether the registrant (1) has filed all reports required to be filed by Section 13 or 15(d) of the Securities Exchange Act of 1934 during the preceding 12 months (or for such shorter period that the registrant was required to file such reports), and (2) has been subject to such filing requirements for the past 90 days. Yes x No o
Indicate by check mark whether the registrant has submitted electronically every Interactive Data File required to be submitted pursuant to Rule 405 of Regulation S-T (§ 232.405 of this chapter) during the preceding 12 months (or for such shorter period that the registrant was required to submit such files). Yes x No o
Indicate by check mark whether the registrant is a large accelerated filer, an accelerated filer, a non-accelerated filer, a smaller reporting company, or an emerging growth company. See the definitions of “large accelerated filer,” “accelerated filer,” “smaller reporting company,” and “emerging growth company” in Rule 12b-2 of the Exchange Act.
Large accelerated filer o
|
Accelerated filer o
|
|||||||||||||
If an emerging growth company, indicate by check mark if the registrant has elected not to use the extended transition period for complying with any new or revised financial accounting standards provided pursuant to Section 13(a) of the Exchange Act. o
Indicate by check mark whether the registrant has filed a report on and attestation to its management’s assessment of the effectiveness of its internal control over financial reporting under Section 404(b) of the Sarbanes-Oxley Act (15 U.S.C. 7262(b)) by the registered public accounting firm that prepared or issued its audit report. o
If securities are registered pursuant to Section 12(b) of the Act, indicate by check mark whether the financial statements of the registrant included in the filing reflect the correction of an error to previously issued financial statements. o
Indicate by check mark whether any of those error corrections are restatements that required a recovery analysis of incentive-based compensation received by any of the registrant’s executive officers during the relevant recovery period pursuant to §240.10D-1(b). o
Indicate by check mark whether the registrant is a shell company (as defined in Rule 12b-2 of the Act). Yes o No x
The aggregate market value of shares of the registrant’s common stock held by non-affiliates as of June 30, 2024 was approximately: $214,196,866
The number of shares of the registrant’s common stock outstanding at February 27, 2025: 32,662,683
DOCUMENTS INCORPORATED BY REFERENCE
Portions of the registrant’s definitive proxy statement relating to its 2025 annual meeting of stockholders (the "2025 Proxy Statement") are incorporated by reference into Part III of this Annual Report on Form 10-K. The 2025 Proxy Statement will be filed with the Securities and Exchange Commission within 120 days after the end of the fiscal year covered by this Annual Report on Form 10-K.
TABLE OF CONTENTS
Page No. |
||||||||
i
FORWARD-LOOKING STATEMENTS
All references to the “Company,” “Bowhead,” “we,” “our” and “us,” unless the context otherwise requires, are to Bowhead Specialty Holdings Inc., a Delaware corporation, and its consolidated subsidiaries.
This Annual Report on Form 10-K contains forward-looking statements within the meaning of the Private Securities Litigation Reform Act of 1995. All statements other than statements of historical facts contained in this Annual Report on Form 10-K, including statements regarding our future results of operations or financial condition, business strategy and plans, and objectives of management for future operations are forward-looking statements.
Some of the forward-looking statements can be identified by the use of terms such as “believes”, “expects”, “may”, “will”, “should”, “could”, “seeks”, “intends”, “plans”, “estimates”, “anticipates” or other comparable terms. However, not all forward-looking statements contain these identifying words. These forward-looking statements include all matters that are not related to present facts or current conditions or that are not historical facts. They appear in a number of places throughout this Annual Report on Form 10-K and include statements regarding our intentions, beliefs or current expectations concerning, among other things, our consolidated results of operations, financial condition, liquidity, prospects and growth strategies, management’s expectations with respect to any regulatory actions related to Insurance Regulatory Information System (“IRIS”) ratio results, the industries in which we operate, and other statements relating to our future performance.
Forward-looking statements are subject to known and unknown risks and uncertainties, many of which are beyond our control. Our actual results may differ materially from those expressed in, or implied by, the forward-looking statements included in this Annual Report on Form 10-K as a result of various factors, including, among others:
•our inability to accurately assess our underwriting risk;
•intense competition for business in our industry;
•our inability to maintain our strategic relationship with American Family Mutual Insurance Company, S.I. (“AFMIC” and together with its subsidiaries, “AmFam”);
•a decline in AmFam’s financial strength rating or financial size category;
•exposure to certain risks arising out of our reliance on insurance retail agents, brokers and wholesalers as distribution channels;
•inadequate losses and loss expense reserves to cover our actual losses;
•unexpected changes in the interpretation of our coverage or provisions, including loss limitations and exclusions, in our policies;
•our reinsurers’ failure to reimburse us for claims on a timely basis, or at all;
•adverse economic factors and their impact on our growth and profitability;
•existing or future regulation and our ability to comply with these regulations;
•the loss of one or more key personnel;
•disruptions of our operations due to security breaches, loss of data, cyber-attacks and other information technology failures;
•increased costs as a result of operating as a public company; and
•other risks and uncertainties discussed in Part I, Item 1A of this Annual Report on Form 10-K.
ii
Forward-looking statements speak only as of the date on which they are made. Except as expressly required under federal securities laws or the rules and regulations of the Securities and Exchange Commission ("SEC"), we do not assume any obligation to update or revise any forward-looking statement, whether as a result of new information, future events or otherwise. You should not place undue reliance on forward-looking statements. All forward-looking statements attributable to us are expressly qualified by these cautionary statements.
iii
PART I
ITEM 1 BUSINESS
Who We Are
We were founded in September 2020, backed by capital provided by GPC Partners Investments (SPV III) LP (“GPC Fund”), a private equity fund managed by Gallatin Point Capital LLC (“Gallatin Point”), and our strategic partner, AmFam, to take advantage of favorable pricing environments, and to address a growing and unmet demand from brokers and policyholders for specialized insurance solutions and quality service in complex lines of business. Our principal objective is to create and sustain superior returns for our stockholders by generating consistent, underwriting profits across our product offerings and through all market cycles, while prudently managing capital.
We offer commercial specialty property and casualty (“P&C”) insurance products to policyholders that vary in size, industry and complexity, focusing on casualty, professional liability, and healthcare liability risks. We provide “craft” underwriting solutions, which require deep underwriting and claims expertise in order to produce attractive financial results. In May 2024, we supplemented our “craft” solution with our “flow” underwriting operation, which is a streamlined, tech-enabled low touch form of underwriting, focused on small, niche and hard-to-place risks. Our policies are primarily written on a non-admitted, or excess and surplus lines (“E&S”) basis, which is free of rate and policy form restrictions, and provides the flexibility to rapidly adjust to emerging market opportunities. We distribute our products through carefully selected relationships with leading distribution partners in both the wholesale and retail markets.
The policies we write are issued on AmFam paper under their own name through our wholly-owned managing general agency subsidiary, Bowhead Specialty Underwriters, Inc. (“BSUI”), in exchange for a ceding fee (“Ceding Fee”), and reinsured 100% to Bowhead Insurance Company, Inc. (“BICI”), our wholly-owned insurance company subsidiary. This mutually beneficial partnership with AmFam has enabled us to grow quickly, but prudently, to take advantage of favorable market conditions, and allows us to deploy capital efficiently.
We are a nimble, remote-friendly organization that is able to attract best-in-class talent nationwide, who are committed to operational excellence and superior service. We are led by a highly experienced and respected underwriting team with a disciplined approach to underwriting and decades of individual, successful underwriting experience. We are supported by a collaborative culture that spans all functions of our business, which allows us to provide a consistent, positive experience for all our partners. We believe that our current market opportunity, differentiated expertise, relationships, culture and leadership team position us well to continue to grow our business profitably.
Our Business
Our Products
We currently offer underwriting solutions to a wide variety of businesses across four underwriting divisions: Casualty, Professional Liability, Healthcare Liability, and Baleen Specialty.
Casualty
Our Casualty division provides tailored solutions on a primary and excess basis through a wholesale-only distribution channel and consists of a team of experienced underwriters with nationwide capabilities who excel at handling complex risks. We specialize in general liability coverage, which protects a company against liability arising from bodily injury, personal injury or property damage, for risks in the construction, distribution, heavy manufacturing, real estate, public entity and hospitality segments and also consider underwriting risks in a broader range of industries. In the fourth quarter of 2024, we offered a new environmental liability product, providing excess contractors pollution and professional liability coverage through specialized wholesale and retail distribution partners.
1
Professional Liability
Our Professional Liability division provides underwriting solutions on both an admitted and E&S basis for standard and nonstandard risks, and writes a broad variety of entities, including publicly traded and privately held financial institutions as well as not-for-profit organizations. We distribute this business through wholesale and retail channels. We offer management liability products, including Directors and Officers liability, Errors and Omissions liability, Employment Practices liability, Fiduciary liability, Fidelity liability and Miscellaneous Professional liability, Crime insurance, and Cyber. We provide primary coverage and excess coverage for most of our Professional Liability products.
Healthcare Liability
Bowhead’s Healthcare Liability division focuses solely on healthcare entities to provide tailored solutions. We offer Professional and General Liability coverage, as well as Management Liability coverage, across four major healthcare segments—hospitals, miscellaneous medical facilities, senior care providers, and managed care organizations—through select wholesale and retail channels.
Baleen Specialty
Baleen Specialty is a technology-powered underwriting operation that specializes in small to mid-sized risks that are not eligible in the admitted market. We have a wholesale-only distribution model and offer exclusively non-admitted products. Currently, we offer general liability products for two segments – Construction and Real Estate, and our coverage offering is restrictive, as customers are typically distressed or hard-to-place. Typically, small to mid-sized E&S risks are placed through binding authorities managed by wholesale brokers. Using technology, Baleen Specialty can quickly intake, evaluate, and respond, with either declinations or a quote, in a reliable manner. Baleen Specialty’s appetite will continue to expand to meet the evolving needs of our wholesale broker partners.
The table below provides our gross written premiums by underwriting division for the years ended December 31, 2024, 2023, and 2022:
| Years Ended December 31, | |||||||||||||||||||||||||||||||||||
| 2024 | % of Total | 2023 | % of Total | 2022 | % of Total | ||||||||||||||||||||||||||||||
| ($ in thousands, except percentages) | |||||||||||||||||||||||||||||||||||
| Casualty | $ | 431,817 | 62.1 | % | $ | 277,455 | 54.7 | % | $ | 192,592 | 54.0 | % | |||||||||||||||||||||||
| Professional Liability | 160,651 | 23.1 | % | 145,251 | 28.6 | % | 105,367 | 29.5 | % | ||||||||||||||||||||||||||
| Healthcare Liability | 101,619 | 14.6 | % | 84,982 | 16.7 | % | 58,989 | 16.5 | % | ||||||||||||||||||||||||||
| Baleen Specialty | 1,630 | 0.2 | % | — | — | % | — | — | % | ||||||||||||||||||||||||||
| Gross written premiums | $ | 695,717 | 100.0 | % | $ | 507,688 | 100.0 | % | $ | 356,948 | 100.0 | % | |||||||||||||||||||||||
Through our strategic partnership with AmFam, we are able to write business on an admitted basis in all 50 states and Washington D.C. and on a non-admitted basis, in all 50 states, Washington D.C., Puerto Rico and selected risks in Bermuda and the Cayman Islands where such risks are being handled by a U.S. broker.
2
The table below provides our gross written premiums in the top five states we do business for the years ended December 31, 2024, 2023, and 2022:
| Years Ended December 31, | |||||||||||||||||||||||||||||||||||
| 2024 | % of Total | 2023 | % of Total | 2022 | % of Total | ||||||||||||||||||||||||||||||
| ($ in thousands, except percentages) | |||||||||||||||||||||||||||||||||||
| California | $ | 123,398 | 17.8 | % | $ | 84,578 | 16.7 | % | $ | 64,323 | 18.0 | % | |||||||||||||||||||||||
| Florida | 84,136 | 12.1 | % | 67,602 | 13.3 | % | 38,360 | 10.7 | % | ||||||||||||||||||||||||||
| Texas | 64,334 | 9.2 | % | 49,915 | 9.8 | % | 32,476 | 9.1 | % | ||||||||||||||||||||||||||
| New York | 54,839 | 7.9 | % | 52,244 | 10.3 | % | 38,402 | 10.8 | % | ||||||||||||||||||||||||||
| Illinois | 32,716 | 4.7 | % | 25,587 | 5.0 | % | 15,858 | 4.4 | % | ||||||||||||||||||||||||||
| Other | 336,294 | 48.3 | % | 227,762 | 44.9 | % | 167,529 | 47.0 | % | ||||||||||||||||||||||||||
Gross written premiums |
$ | 695,717 | 100.0 | % | $ | 507,688 | 100.0 | % | $ | 356,948 | 100.0 | % | |||||||||||||||||||||||
Competition
The commercial specialty P&C insurance industry is highly competitive. We compete with domestic and international insurers, MGAs and program administrators, some of which have greater financial, marketing and management resources and experience than we do. We may also compete with new market entrants in the future. Competition is based on many factors, including the perceived market strength of the insurer, pricing and other terms and conditions, services provided, the speed of claims payment, the experience and reputation of members of the underwriting and claims teams and ratings assigned by independent rating organizations, such as A.M. Best. Our competition is broad and certain competitors may be specific to only one or two of our underwriting divisions. Some of our notable competitors include American International Group, Inc., Arch Capital Group Ltd., AXA S.A., AXIS Capital Holdings Ltd., Berkshire Hathaway Corporation, C.V. Starr & Co., Inc., Chubb Ltd., Cincinnati Financial Corporation, CNA Financial Corporation, Liberty Mutual Insurance Company, Nationwide Mutual Insurance Company, The Doctors Company, The Travelers Companies, Inc. and W.R. Berkley Corporation. In determining this list of competitors, we considered factors such as the number of policies and/or the amount of premiums written by such companies and such companies’ reputations within the space.
Our Competitive Strengths
We believe that our competitive strengths include:
Focus on targeted, commercial specialty P&C insurance market segments with profitable growth opportunities. We primarily operate in the $83.3 billion U.S. commercial E&S market (for the year ended December 31, 2023) that has grown 20.9% annually since 2019. We entered into specific segments of this market where we believe we can achieve profitable growth based on our significant underwriting expertise or by acquiring talent with proven track records of generating underwriting profits. Certain of our target markets have experienced meaningful dislocations, allowing favorable market conditions to continue. We believe that we have positioned ourselves as a leader within our sectors and that our specialized, innovative and customized underwriting approach, combined with our strong broker relationships will provide us with an enduring competitive advantage.
Disciplined approach to underwriting led by highly experienced teams with specialized expertise. Our underwriting team is led by industry veterans, who have each served as senior insurance executives, with decades of relevant industry experience. They bring specialized industry knowledge, strong distribution relationships and long track records of underwriting profitability in the lines of business we specialize. We underwrite each risk individually, within prudently managed risk limits, to meet the unique demands of our policyholders. We focus on delivering accurate pricing, speed of execution and consistency to our clients across market cycles.
3
Fully integrated and accountable underwriting value chain. We maintain strict control across our underwriting value chain, which is managed in-house and fully integrated across origination, structuring, data and analytics, actuarial, claims and legal. These functional teams are not siloed; they collaborate closely with our underwriters to deliver flexible solutions to our customers quickly and profitably. Our organization is singularly focused on underwriting profitability.
Deep, long-term distribution relationships based on expertise, service and mutual benefit. Our management team and underwriters have built meaningful long-term relationships with the leading distributors in their respective lines of business. We are selective in choosing our distribution partners and look for those that have technical expertise in our chosen lines and a shared commitment to excellent service. Further, we seek out relationships where we have the ability to write a significant portion of a distribution partner’s business. We provide our brokers timely responses and feedback to submissions, and mobilize resources across the organization to ensure the appropriate deal gets done. As a result, we consistently receive high-quality business from our broker network. We believe our existing broker relationships and our approach to maintaining these relationships are key components to our long-term growth and success.
Highly collaborative and execution-oriented culture that spans across all functions working toward a common goal of underwriting profitability. Across our company, we collaborate at all levels and operational functions. We frequently hold roundtable discussions where key members of our team provide insights and perspectives, which allow us to assess emerging opportunities quickly and holistically, all while establishing a common culture of excellence. We leverage technology and our flat organizational structure to mobilize our resources across the organization to promptly execute on opportunities.
Nimble and efficient platform with hybrid operating model and modern technology. We built our operating platform on a remote-first basis using leading-edge technology. We believe our hybrid operating model provides us with a significant competitive advantage, allowing us to attract and retain the best industry talent from across the country and to deploy them locally to meet our clients’ unique needs. Our cloud-based modern technology systems allow us to run day-to-day operations efficiently and integrate new tools seamlessly. We developed our pricing and analytics tools purposefully in-house and we strategically leverage third-party technology partnerships where we deem them to be more efficient. We are unburdened by the typical legacy system issues that impact many of our competitors.
Strong balance sheet and no reserves from accident years prior to 2020. We believe our strong balance sheet is a key advantage that enables us to grow our business while delivering strong financial performance. We entered the market towards the end of 2020 when insurance rates were starting to increase following multiple years of rate inadequacy. Since then, we have continued to experience a favorable pricing environment, while many of our competitors are confronting the potential for adverse development.
Experienced and entrepreneurial leadership team. We have assembled what we believe is a best-in-class team of leaders from across the P&C industry. Our team is comprised of highly experienced executives who have previously held leadership roles across underwriting, claims, actuarial, technology, legal and operations at leading insurance companies. We are led by our founder and Chief Executive Officer, Stephen Sills, who has over four decades of experience leading businesses in the commercial specialty P&C insurance industry. Our underwriting team is led by David Newman, our Chief Underwriting Officer, who, along with our underwriting division leads, have extensive experience in the P&C industry. In addition, our board of directors includes accomplished industry practitioners who bring decades of invaluable experience from prior roles at insurance and financial services companies.
4
Our Strategy
We believe that our approach to our business will allow us to achieve our goals of both growing our business and generating attractive returns for our stockholders. Our strategy involves:
Attract and retain best-in-class talent across the business. Our long-term success as an organization relies on hiring and retaining the right people to help us grow our business profitably. We seek to hire talented professionals nationwide with strong industry experience and technical expertise across our organization to help drive underwriting performance and operational efficiencies. We believe that our hybrid operating model and entrepreneurial, collaborative, execution-driven and customer-first culture have made us a company of choice for the best talent in the industry.
Profitably grow our existing lines of business. We are focused on generating an underwriting profit while growing our existing book of business sustainably. Our business lines are highly specialized and require deep industry knowledge and strong execution capabilities. As a result, we believe we can generate underwriting profitability by identifying market dislocations early and executing on these opportunities quickly. As the demand for specialized insurance solutions continues to rise, we expect to capitalize on the broader market opportunity and expand our market share to generate strong underwriting results.
Opportunistically and strategically expand into new products and markets. We are focused on generating long-term value for our stockholders, which includes expanding into new products and markets. We actively evaluate new lines of business for capital deployment based on our established capabilities in the commercial specialty P&C insurance market. We believe we can leverage our distribution relationships and expertise in our Casualty, Professional Liability and Healthcare Liability divisions to expand into adjacent lines and classes that share a similar underwriting framework. We also believe there is an attractive opportunity in the small and micro commercial lines segment, where we can generate new and profitable growth opportunities by leveraging our existing expertise and distribution relationships. We regularly monitor the broader market for organic expansion opportunities, where we believe there is alignment between our capabilities and our perception of attractive underlying market conditions and needs.
Maintain our underwriting-first culture across market cycles. We strive to deliver consistent and strong underwriting results across all market cycles. We take a methodical approach to building our lines of business and our distribution network. We do not chase pricing trends; we aim to get ahead of such trends by identifying leading indicators at the micro level, forming our own view of risks and executing promptly when opportunities arise. We will only pursue lines of business that align with our expertise and expected underwriting profitability. We have developed tools and resources to enable quick and accurate decision-making and to monitor alignment between our underwriting framework and bottom-line results. We believe our continuous focus on underwriting excellence will allow us to generate profitable growth through all market cycles.
Leverage expertise, technology, data and analytics to drive underwriting performance. Since the establishment of our platform, we have made significant investments in technology and will continue to do so to support our growth and operational efficiency. We leverage our proprietary Bowhead Risk Analysis Tools (“BRATs”) to drive efficiency, accuracy and speed in our underwriting process. BRATs allow underwriters to streamline underwriting workflows and make pricing decisions that are based on a consistent view of risk informed by our own loss experience and broader industry level developments. We continue to introduce and integrate new tools into our internal system to allow our underwriters to process quotes more efficiently and perform day-to-day tasks in seamless coordination with other functions. Our goal as an organization is to build a technology stack that frees up our underwriters from performing highly repetitive, uniform tasks, which allows them to apply judgment, creativity and critical thinking to form solutions that can be executed quickly. Our focus on developing technology, data and analytics to drive efficiency is central to our “underwriting-first” strategy.
5
Deliver attractive returns on capital to our stockholders. We intend to deliver attractive underwriting results, overall profitability and returns to our stockholders through underwriting expertise and disciplined risk management, supported by a conservative investment strategy, legacy-free reserves and prudent approach to capital deployment. We aim to take advantage of our strong balance sheet to deploy capital prudently and profitably across market cycles. We believe that current market conditions present an attractive opportunity for growth, and that our underwriting-first approach will allow us to generate profitable and sustainable underwriting results over the long term.
Our Structure
Bowhead Specialty Holdings Inc. (“BSHI”) is a Delaware domiciled insurance holding company that offers commercial specialty P&C insurance products in the U.S., focusing on casualty, professional liability, and healthcare liability risks, which are primarily written on an E&S basis. We conduct our business operations through three wholly-owned subsidiaries. BSUI is the Company’s managing general agency, holding a resident insurance license in the State of Texas, and is domiciled in the State of Delaware. BICI is the Company’s insurance company subsidiary licensed and domiciled as an admitted insurer in the State of Wisconsin. Bowhead Underwriting Services, Inc. (“BUSI”) is the Company’s services company domiciled in the State of Delaware.
We have a strategic partnership with AmFam that allows us to issue policies under AmFam paper and cede 100% of this business to BICI, in exchange for a Ceding Fee. This is facilitated through three Managing General Agency Agreements (the “MGA Agreements”) with Homesite Insurance Company, Homesite Insurance Company of Florida, and Midvale Indemnity Company (together the “AmFam Issuing Carriers”), each of which is a wholly-owned subsidiary of AFMIC. BSUI is also party to third-party broker agreements, allowing the direct payment of premiums from the brokers to BSUI. Through the MGA agreements, BSUI writes premium and provides claim handling services on behalf of the AmFam Issuing Carriers, and BICI assumes 100% of the premium, net of any inuring third-party reinsurance, through a Quota Share Agreement with AFMIC (the “AmFam Quota Share Agreement”). AmFam receives a Ceding Fee on net premiums assumed by BICI. BICI is also party to an Insurance Trust Agreement pursuant to which BICI provides collateral to support the obligations of the AmFam Quota Share Agreement.
AFMIC beneficially owns approximately 14.4% of the Company’s issued and outstanding common stock as of December 31, 2024. In addition, on May 22, 2024, in connection with our initial public offering (the “IPO”), we issued Warrants to AFMIC for the right to purchase a total of 1,670,721 shares of the Company’s common stock at an exercise price of $17.00 per share. The Warrants vest 20% per year over the five-year service period and the vested portion of the Warrants may be exercised at any time, in whole or in part, until the ten-year anniversary of the issuance dates. This mutually beneficial partnership with AmFam has enabled us to grow quickly, but prudently, to take advantage of favorable market conditions, and allows us to deploy capital efficiently.
Prior to our IPO, BSHI was wholly-owned by Bowhead Insurance Holding LP, a Delaware limited partnership (“BIHL”). BIHL’s limited partners included GPC Fund, AMFIC, members of Bowhead’s management and other minority investors. Following the IPO, the shares of our common stock held by BIHL were either distributed to BIHL’s limited partners or sold in a secondary offering of our common stock on October 25, 2024. Following October 25, 2024, BIHL was no longer a holder of our common stock.
Marketing and Distribution
We go to market under the Bowhead brand, leveraging the strong reputation we quickly established within the broker community. Our products are distributed through carefully selected relationships with leading distribution partners in both the wholesale and retail markets. In our Casualty and Baleen Specialty divisions, we partner exclusively with wholesale distributors, with the exception of our environmental liability business, which partners with both specialized wholesale and retail distributors, whereas in Professional Liability and Healthcare Liability, we work with a combination of wholesale and retail distribution partners. In addition, while we generally do not delegate underwriting and binding authority, we do distribute an insurance product through a program administrator in connection with a risk purchasing group to whom we have issued a master policy.
6
We source our distribution relationships based on the quality of their business, reputation and alignment of long-term objectives. We carefully cultivate our broker network, regularly evaluating both new and existing relationships based on the market opportunities we decide to pursue. Many of our distribution partners have more than one office, and for these partners, we evaluate each office on a standalone basis. Brokers must demonstrate the ability and willingness to consistently produce the type of high-quality business that aligns with our underwriting appetite. In return, we deliver mutually beneficial and bespoke solutions to meet the demand of our wholesale and retail distribution partners. We strive to maintain a core group of brokers that will consider us to be their first and last call.
We believe that we have strong relationships with our distribution partners due to the quality, knowledge and expertise of our management team and underwriters. We believe that our underwriters have a “following” with their distribution partners and that this “following” creates an attractive volume of submissions fitting our underwriting appetite and for which our underwriters can provide craft solutions. We are committed to exceeding our partners’ expectations through excellent service, product and expertise.
Underwriting
We have established an underwriting-first culture, where from the top down, underwriting profitability is our “North Star.” Our “craft” form of underwriting is highly collaborative and customized, while our “flow” underwriting solution, despite being a technology-powered underwriting platform that offers restrictive coverage, involves underwriting and collaboration upfront before a product is released. Our extensive underwriting expertise and carefully cultivated broker relationships allow us to provide consistent feedback and quick responses to our distribution partners, which is how we win business. We hire who we believe are best-in-class talent nationwide, with proven track records of generating underwriting profits within their respective product lines. We take pride in building a strong underwriting culture through a referral-driven recruiting approach, with many new hires having previously worked with our existing employees. Our underwriting team is led by David Newman, our Chief Underwriting Officer, who, along with our underwriting division leads, have extensive experience in the P&C industry.
Our underwriting teams are knowledgeable, experienced and have well established relationships with our key distribution partners. These characteristics are critical to operating successfully in our target markets since many of the risks we write require customized solutions and individual risk underwriting. We have a culture of collaboration and execution, with a streamlined organizational structure that focuses on flexibility and delivering feedback on price and structure in a timely manner to brokers.
We have formal underwriting rules, but also utilize the expertise of our underwriters and capabilities of our platform to produce a consistent approach to pricing and risk throughout the organization. All underwriters have formal authority for the risks they bind. We provide our underwriters with the tools necessary for them to evaluate and price the complex risks on which they work; however, our underwriters do not underwrite risks in isolation.
Roundtables also form a key part of our craft underwriting process. Depending upon the risk, roundtables can occur at multiple levels across the organization and often involve functions outside of our underwriting teams, including actuarial, claims, legal and finance. Not only does this approach optimize the quality of the decision making on the opportunities presented to our underwriters, but it also leads to a more consistent product for our counterparties. Our culture of collaboration and accountability reduces the number of underwriting decisions made in isolation. We believe this approach allows us to achieve superior risk selection and pricing, which results in mutually beneficial relationships with our distribution partners. We believe this approach will generate sustainable best-in-class underwriting performance across market cycles.
We are highly selective in the policies we choose to bind. If we determine that we are not able to profitably write coverage at the price or terms submitted, we provide appropriate and timely feedback to our distribution partners quickly. This responsiveness is one of the reasons we believe we are often considered a broker’s first call.
7
Within our “craft” form of underwriting, on the business that we accept, we underwrite each risk on a case-by-case basis, carefully establishing price and terms that are adequate for the underlying exposure, with disciplined parameters and strict policy limits. We often customize our policies, and our underwriters use our legal department to draft all policy forms and any endorsements that modify coverage. We predominantly write non-admitted business in the E&S market and use the flexibility of rate and form to ensure that the risk and coverage we provide are customized to the unique needs of the market while always focusing on underwriting profitability.
Claims
Our claims handling teams are structured to align with our underwriting divisions and led by our Chief Claims Officer. Each of our claims handling specialists, most of whom have extensive experience in law firms as litigation attorneys and/or claims handling experience in insurance companies, focuses on specific lines of business where they have expertise. Our claims management teams have significant experience in the markets on which we focus and are deeply integrated across our underwriting, actuarial and legal departments, ensuring a consistent approach to all claims matters.
We handle our claims in-house with a focus on high-touch customer service and effective management of the claims resolution process. We aim to settle claims efficiently and fairly, which we believe is a key competitive differentiator, whereby submitted claims are reviewed by a minimum of two or more members of the claims department. Our claims department works closely with our underwriting and actuarial teams, keeping them informed of claims trends, providing feedback on emerging areas of loss experience, and identifying and addressing key issues and adjusting reserves as appropriate.
Our claims system produces real-time information on open claims and regular reporting of detailed claims metrics utilized by senior leadership and the claims team. We believe that our extensive industry experience, agile culture and technology-assisted claims processes enable us to reach fair and appropriate claim resolutions for our customers.
Our approach is to promptly investigate claims and consider all aspects of each loss, provide our customers with quality claims handling and engagement throughout the claims process, promptly establish claims reserves and leverage expert legal and other external resources as needed to deliver fair outcomes across our businesses. We do not use any third-party administrators to handle claims. We believe maintaining full control of the claims-handling process allows us to meet our rigorous quality standards and manage our losses and LAE effectively, ultimately allowing us to win business and drive underwriting profitability.
Reserves
We maintain loss and loss adjustment case reserves for specific claims incurred and reported in addition to reserves for losses incurred but not yet reported (“IBNR”). The amount that we ultimately pay out for claims may be greater or less than the reserves we hold on our Consolidated Balance Sheets. There is always a risk that posted reserves may prove to be inadequate or redundant. We monitor case reserves and IBNR by incorporating any new information in case reserve updates and by actuarial analysis of IBNR. Anticipated inflation is reflected implicitly in the reserving process through analysis of cost trends and the review of historical development. We do not discount our reserves for losses and loss adjustment expenses to reflect estimated present value.
When a claim is reported to us, it is assigned to a specific claim handler based on the lines of business. The claim handler assigns an initial claim rating that indicates their view of potential exposure to loss based on available information at that time. Claim ratings are reviewed and updated regularly throughout the life of a claim. A case reserve is then established to indicate the estimated amount of ultimate loss and loss adjustment exposure to us after an assessment of coverage and damages and any other investigations conducted, as applicable. The estimate is based on the claim handler’s experience and knowledge of the nature and value of the specific type of claim. Individual case reserves are periodically adjusted, either increased or decreased, based on subsequent developments associated with each claim.
8
We establish IBNR reserves in accordance with industry practice to provide for (i) the estimated amount of future loss and loss adjustment payments on incurred claims not yet reported and (ii) potential development on reported claims. IBNR reserves are estimated based on generally accepted actuarial reserving techniques that take into account our loss experience, pricing adequacy indications as well as benchmark historical and projected loss experience of comparable lines of business written by other insurance carriers.
Reserves are monitored and updated regularly to reflect any changes in paid or reported claims and case reserves. The indicated results of standard actuarial techniques for estimating IBNR are compared with held IBNR. The indicated versus booked IBNR estimates are reviewed quarterly with members of senior management. In addition, our loss reserves are reviewed at the end of each third quarter and at year-end by an independent actuarial consulting firm, which also supports us by providing the year-end written Statement of Actuarial Opinion as required by the National Association of Insurance Commissioners (“NAIC”).
The parameters for the reserve adequacy exercise and monitoring are discussed and informed by the work of the independent actuarial consulting firm. These parameters include Reporting Development Patterns, Paid Development Patterns, and Initial Expected Loss Ratios, which are used in Paid and Incurred Loss Development, Bornhuetter-Ferguson Paid and Incurred, Cape Cod, and Expected Loss Ratio techniques for estimating IBNR. Given our short history, reserving parameters are based on industry data and benchmarks available to and analyzed by the independent actuarial consulting firm, adjusted where appropriate to reflect our claims and underwriting practices and supplemented by our pricing model data. Over time, we expect to put increasing reliance on parameters based on our own loss data and claims practices.
Separate sets of parameters are established for lines of business. Reserving cohorts are used to group data together with similar expected reporting and payout patterns. Estimates of IBNR are calculated for lines of business and then consolidated to provide an overall picture for the company. Estimates are calculated on both a gross and a net of reinsurance basis.
Case and IBNR reserves may be increased or decreased over time as claims move to ultimate settlement, dismissal or closure. Changes in reserves for historical years can impact earnings via adverse development (increases) or reserve releases (decreases). The reserve estimates contain an inherent level of uncertainty and actual results may vary, potentially significantly, from the initial estimates.
The following table presents the development of our loss reserves calculated in accordance with generally accepted accounting principals in the United States “U.S. GAAP” as of December 31 for each year:
| Net Ultimate Loss and Loss Adjustment Expenses | ||||||||||||||||||||||||||||||||||||||||||||
| Calendar Year | Development | |||||||||||||||||||||||||||||||||||||||||||
| Accident Year | 2021 | 2022 | 2023 | 2024 | 2021 to 2022 | 2022 to 2023 | 2023 to 2024 | |||||||||||||||||||||||||||||||||||||
($ in thousands) |
||||||||||||||||||||||||||||||||||||||||||||
| Prior | — | — | — | — | — | — | — | |||||||||||||||||||||||||||||||||||||
| 2021 | $ | 34,518 | $ | 32,212 | $ | 32,212 | $ | 25,465 | $ | (2,306) | $ | — | $ | (6,747) | ||||||||||||||||||||||||||||||
| 2022 | — | 114,066 | 114,066 | 115,824 | — | — | 1,758 | |||||||||||||||||||||||||||||||||||||
| 2023 | — | — | 166,282 | 171,271 | — | — | 4,989 | |||||||||||||||||||||||||||||||||||||
| 2024 | — | — | — | 248,099 | — | — | — | |||||||||||||||||||||||||||||||||||||
Total Reserve Development |
$ | (2,306) | $ | — | $ | — | ||||||||||||||||||||||||||||||||||||||
9
Reinsurance
We purchase various forms of reinsurance to manage loss exposures and safeguard our capital. Through reinsurance, we transfer certain exposures to a reinsurer, and in return, the reinsurer receives a portion of the premium, less a ceding commission paid to us. We strategically use a combination of quota share and excess of loss reinsurance treaties to retain risk, while providing balance sheet protection from larger losses. We may also place facultative reinsurance on specific risks we deem prudent.
A quota share reinsurance treaty is an agreement where reinsurers assume a percentage of the company’s losses in exchange for a negotiated percentage of premium. An excess of loss reinsurance treaty is an agreement where reinsurers agree to assume a portion of losses for a specific event in excess of a specified amount in return for a negotiated premium. Reinsurance needs are determined with principal input from our Chief Underwriting Officer, based on a multitude of factors, including risk appetite, market conditions, loss history and reinsurance capacity.
We place reinsurance through our insurance company subsidiary, BICI, which reinsures 100% of the premium placed by BSUI with the AmFam Issuing Carriers. In turn, BICI strategically transfers exposures to third-party reinsurers utilizing different structures depending on the line of business.
We generally offer up to $15 million of limit on our insurance policies and seek not to retain more than $5 million, utilizing reinsurance to achieve that objective. At each renewal, we consider various factors when determining our reinsurance coverage, including (i) plans to change the underlying insurance coverage we offer, (ii) trends in loss activity, (iii) the level of our capital and surplus, (iv) changes in our risk appetite and (v) the cost, terms and availability of reinsurance coverage. We may adjust our reinsurance program, including our levels of retention based on these factors.
As of December 31, 2024, we had the following significant reinsurance programs:
•For all lines, except Cyber, we use a quota share reinsurance treaty, where 25.0% of the exposure is ceded to reinsurers, and an excess of loss reinsurance treaty, which cedes 60.1% of losses in excess of $5 million up to $15 million to our reinsurers.
•Cyber, as a specialized line of business, is placed under a separate quota share structure, where we cede 64.0% of the exposure to reinsurers. There is no separate excess of loss reinsurance program for our Cyber line of business.
•We also entered into a quota share treaty, effective March 1, 2024, covering commercial auto exposure in excess of $1 million up to $5 million within our Casualty book of business.
Our reinsurance treaties are currently subject to caps, which currently range from 250% to 350% of the subject matter ceded premium, and should these caps be exceeded we would retain any losses in excess of those caps.
Our reinsurance treaties typically have 12- or 18-month terms. While we intend to renew on similar terms as expiring to maintain our desired level of net risk appetite, during each renewal cycle, we may change our coverage terms or the composition of our reinsurance panel. Currently, the quota share reinsurance treaty for Cyber generally renews on January 1, 2025 while the remainder of our reinsurance treaties renew on May 1, 2025.
All reinsurance involves credit risk, since we maintain the direct obligation to pay losses incurred by our policyholders up to our policy limits. Accordingly, when selecting our reinsurers, a potential reinsurer’s financial strength is the paramount consideration. All of our reinsurance business is placed with reinsurers that have an A.M. Best rating of “A” (Excellent) or better. As of December 31, 2024, we have never had an allowance for uncollectible reinsurance.
10
The following table summarizes our top five reinsurers, their A.M. Best financial strength rating and percent of our total reinsurance recoverables as of December 31, 2024:
| Reinsurer | A.M. Best Rating | % of Total | ||||||||||||
| Renaissance Reinsurance U.S. Inc | A+ | 29.8% | ||||||||||||
| Endurance Assurance Corporation | A+ | 23.8% | ||||||||||||
| Markel Global Reinsurance Company | A | 20.8% | ||||||||||||
| Ascot Bermuda Limited | A | 9.4% | ||||||||||||
| American Family Connect Property and Casualty Insurance Company | A | 7.5% | ||||||||||||
| All other reinsurers | At least A | 8.7% | ||||||||||||
| Total | 100.0% | |||||||||||||
Investments
Investment income is an important component of our business model. Most premiums we collect are held in reserves until claims are paid. We conservatively invest these reserves to supplement our underwriting income between the time of premium collection and a possible claim payment. If an underwriting loss occurs during any given year, investment income can be used to cover underwriting losses before capital is affected.
We seek to maintain a diversified portfolio of fixed income instruments that prioritize capital preservation, with a secondary focus on generating predictable investment income. Our asset allocation strategy focuses on high-quality fixed income instruments, with no equity or alternative investment exposure. One of the primary features of our asset allocation is maintaining sufficient readily available funds to pay claims and expenses. Our portfolio consists entirely of cash, cash equivalents, short-term investments and investment grade fixed income securities.
We actively manage and monitor our investment risk, balancing the goals of capital preservation and income generation with our need to comply with relevant insurance regulatory frameworks and the capital framework agreements with AmFam. Our board of directors reviews and approves our investment policy and strategy on a regular basis, and considers investment activities, performance against benchmarks and new investment opportunities as they arise. The portfolio is managed by a third-party investment management firm, New England Asset Management Inc. (“NEAM”), which is a wholly-owned subsidiary of Berkshire Hathaway Inc. and a registered investment adviser with the SEC under the Investment Advisers Act of 1940. We believe that investment decisions are best made when not excessively restrictive. Therefore, our investment managers have full discretion to carry out investment decisions within the limits of our investment policy and applicable guidelines.
As of December 31, 2024, our fixed income portfolio had a weighted average effective duration of approximately 2.2 years and an average credit rating of AA. Actual maturities may differ for some securities when borrowers have the right to call or prepay obligations with or without penalties.
The securities in our investment portfolio are classified as “available for sale” and are carried at fair value with unrealized gains and losses reported net of tax as a separate component of accumulated other comprehensive income (loss). Fair value is defined as the price that would be received to sell an asset or paid to transfer a liability in an orderly transaction between market participants at the measurement date. Fair value is determined based on a fair value hierarchy that prioritizes the use of observable inputs over the use of unobservable inputs and requires the use of observable inputs when available. For those securities with unrealized losses, we intend to hold them until maturity.
11
Operating Model and Technology Platform
Operating Model
We have a remote-friendly operating model with employees generally working remotely, supplemented by targeted, in-person collaboration. We formed our company during COVID-19 mandated lockdowns, which initially required us to be 100% remote. Founding a digital-first specialty insurer in the midst of national stay-at-home mandates reinforced the importance of finding the appropriate balance between automated processes and human experience. Our management team built our company’s operating platform and developed its culture from the beginning to function nimbly in a remote environment. This approach has enabled us to recruit talented employees nationwide without regard for Bowhead-specific office locations.
We believe our unique operating model is a competitive advantage in terms of attracting talent and maintaining our collaborative culture. Unlike other insurance companies that are trying to bring employees back to the office or that are just now learning to operate in a hybrid model, our remote-friendly operating model is, and has been, an innate part of our culture. We believe this contributes directly to our success. We believe that our employees value the flexibility our operating model and appreciate knowing that we are not trying to change this model or require a full-time return to the office. Contrary to many companies that needed to learn a “new normal” during 2020, launching our business in a remote environment with a team-based culture encouraged our employees to communicate regularly and build virtual working habits that are now deeply ingrained in our daily practices. We believe that our organization thrives in a remote-friendly environment and our employees’ ability to work collaboratively in a remote environment is unique within our industry.
Technology Platform
We utilize technology, data and analytics efficiently throughout each stage of the underwriting process. Our modern, cloud-based underwriting platform enables us to leverage both internally-created and third-party solutions. We developed proprietary underwriting tools, BRATs, for each of the lines we write, which are further supplemented with customized third-party data. Our investments in technology focus on the development, integration and analysis of data, while our technology tools allow us to understand the underlying risks for each line of business, enabling us to provide rapid feedback to brokers on structure and price. Our technology platform is a direct result of the best practices learned from our management’s extensive prior experience at leading insurance companies. We have a new technology platform and we are not burdened by legacy systems and practices that other insurance companies face. We focus our technology investments on improving our capabilities, not on maintaining or replacing outdated systems.
Our BRATs are comprehensive tools used across departments during our underwriting process to evaluate each risk. Our key business leaders leverage their respective BRATs to evaluate submissions and have built line of business-specific capabilities resulting in a custom underwriting process, capturing exposures and drivers of the losses that are relevant to each submission. Each of our “craft” underwriting divisions has its own unique set of BRATs. Each BRAT stores data in our core operating system for each submission, regardless of whether we ultimately write the account. The Professional Liability BRAT data is supplemented by third-party vendor data integrated directly into its algorithm. This effective data management capability has allowed us to build a large data repository of both public and private data despite our brief operating history.
For our core operating platform, including our policy administration, billing and claims systems, we license a cloud-hosted and cloud-architected application from a leading third-party vendor that has been customized for our business. This turnkey application allows us to integrate additional applications from various third-party vendors directly into our core information technology platform, enabling capabilities to be customized by line of business, size of account and underlying risk, among others.
12
REGULATION
Insurance Regulation
Our insurance businesses are subject to regulation and supervision in each of the United States jurisdictions in which they conduct business. State insurance laws and regulations generally are designed to protect the interests of policyholders, consumers and claimants rather than stockholders or other investors. The nature and extent of state regulation varies by jurisdiction, and state insurance regulators generally have broad administrative power relating to, among other matters, setting capital and surplus requirements, licensing of insurers, insurance producers and adjusters, review and approval of product forms and rates, establishing standards for reserve adequacy, prescribing statutory accounting methods and the form and content of statutory financial reports, regulating certain transactions with affiliates and prescribing types and amounts of investments.
Licensing
Our operating subsidiaries, BSUI and BUSI, as well as certain designated employees, must be licensed to act as insurance producers or adjusters, as applicable, by insurance regulatory authorities in the states where they operate. Such insurance regulatory authorities are vested in most cases with relatively broad discretion as to the granting, denying, revocation, suspension and renewal of licenses.
BICI is an insurance company licensed and domiciled in the State of Wisconsin and is primarily regulated by the Office of the Commissioner of Insurance of Wisconsin (the “Wisconsin OCI”). BICI reinsures specialty property and casualty insurance products offered on both an admitted and non-admitted basis, depending on the specific product and market segment. Admitted product rates and forms are highly regulated, while non-admitted insurance is subject to considerably less regulation with respect to policy rates and forms. Currently, BICI assumes 100.0% of the premium underwritten by BSUI on behalf of certain AmFam insurance company subsidiaries, which is predominantly written on a non-admitted basis.
BICI may become licensed to transact insurance in additional jurisdictions in order to write certain lines of business directly, which would subject BICI to regulation in such jurisdictions, including statutes and regulations governing the review and approval of policy rates and forms.
Insurance Holding Company Regulation
We are subject to the insurance holding company laws of Wisconsin, which require BICI to register with the Wisconsin OCI and furnish information concerning the operations of companies within the holding company system that may materially affect the operations, management or financial condition of BICI. These statutes also provide that all transactions among members of a holding company system must be fair and reasonable and, if material or of specified types, such transactions require prior notice and approval or non-disapproval by the Wisconsin OCI.
Changes of Control
Before a person can acquire control of a U.S. domestic insurer, prior written approval must be obtained from the insurance commissioner of the state where the insurer is domiciled, or the acquiror must request an exemption from the Form A filing and approval requirements or a determination of non-control (each, an “Exemption Request”) or file a Disclaimer with the insurance department of such state and obtain approval thereon. Since BICI is domiciled in the state of Wisconsin, the insurance laws and regulations of Wisconsin would be applicable to any proposed acquisition of control of BICI. Under applicable Wisconsin insurance laws and regulations, no person may acquire control of a domestic insurer until written approval is obtained from the state insurance commissioner following a public hearing on the proposed acquisition. Such approval would be contingent upon the state insurance commissioner’s consideration of a number of factors, including, among others, the financial strength of the proposed acquiror, the integrity and management of the acquiror’s board of directors and executive officers, the acquiror’s plans for the future operations of the domestic insurer and any anti-competitive results that may arise from the consummation of the acquisition of control.
13
Wisconsin law provides that control over a Wisconsin domestic insurer is presumed to exist if any person, directly or indirectly, owns, controls, holds with the power to vote, or holds proxies representing, ten percent or more of the voting securities of the domestic insurer. This statutory presumption of control may be rebutted by a showing that control does not exist in fact. The Wisconsin OCI, however, may find that “control” exists in circumstances in which a person owns or controls less than ten percent of the voting securities of the domestic insurer.
Wisconsin insurance laws and regulations pertaining to changes of control would apply to both the direct and indirect acquisition of ten percent or more of the voting stock of a Wisconsin-domiciled insurer (or potentially of less than ten percent of the voting stock if there is other indicia of control). Accordingly, the acquisition of ten percent or more of our common stock would be considered an indirect change of control of BICI and would trigger the applicable change of control filing requirements under Wisconsin insurance laws and regulations, absent the filing of an Exemption Request or Disclaimer and its acceptance by the Wisconsin OCI. These requirements may discourage potential acquisition proposals and may delay, deter or prevent a change of control of us, including through transactions that some or all of our stockholders might consider to be desirable.
Restrictions on Paying Dividends
Substantially all of our operations are conducted through our wholly-owned insurance and service company subsidiaries. Consequently, our ability to pay dividends to stockholders and meet our debt payment obligations is largely dependent on dividends and other distributions from BICI and our other operating companies. BICI’s ability to pay dividends is restricted under the insurance laws and regulations of its domiciliary state and may only be paid from unassigned surplus. Under the insurance laws of Wisconsin, an insurer may make an ordinary dividend payment if its surplus as regards to policyholders, following such dividend, is reasonable in relation to its outstanding liabilities, is adequate to its financial needs and does not exceed the insurer’s unassigned surplus. However, no insurer may pay an extraordinary dividend without the approval or non-disapproval of the Wisconsin OCI. An extraordinary dividend is defined under Wisconsin law as a dividend whose fair market value, together with other dividends paid within the preceding 12 months, exceeds the lesser of (i) 10.0% of the insurer’s surplus with regard to policyholders as of the preceding December 31 or (ii) the greater of (A) the insurer’s net income for the calendar year preceding the date of the dividend, minus realized capital gains for that calendar year, or (B) the aggregate of the insurer’s net income for the three calendar years preceding the date of the dividend, minus realized capital gains for those calendar years and minus dividends paid within the first two of the preceding three calendar years. As of December 31, 2024, the maximum amount of dividends BICI could pay without regulatory approval was $16.1 million.
State insurance regulators require insurance companies to maintain specified levels of statutory capital and surplus. BICI is subject to certain surplus and risk-based capital requirements under a company-specific stipulation and order from the Wisconsin OCI, which became effective on December 18, 2020 in connection with the issuance of BICI’s certificate of authority by the Wisconsin OCI. Pursuant to the Wisconsin OCI Stipulation and Order, BICI is required to (i) have a compulsory surplus equal to the greater of (A) $3.0 million or (B) the sum of (x) 50.0% of gross written premiums for medical malpractice insurance (which business is written as part of our Healthcare Liability division) and (y) 20.0% of gross written premiums for all other covered lines of insurance, (ii) maintain surplus in excess of its required security surplus standard under Wisconsin law and (iii) maintain a ratio of total adjusted capital to authorized control level risk-based capital of not less than 400%. Upon the earlier of (i) a change in control of BICI that requires the filing of a Form A or (ii) the fifth anniversary of the effective date of the Wisconsin OCI Stipulation and Order, BICI may submit a written request for the Wisconsin OCI to consider whether the terms of the Wisconsin OCI Stipulation and Order should be continued or modified. Upon such written request, the Wisconsin OCI will initiate an inquiry to evaluate whether BICI’s business has maintained sufficient capitalization such that the assurances provided by the Wisconsin OCI Stipulation and Order are no longer required or whether any terms or conditions of the Wisconsin OCI Stipulation and Order should be modified. The inquiry would be expected to conclude within 120 calendar days. Insurance regulators have broad powers to prevent reduction of statutory surplus to inadequate levels, and there is no assurance that dividends of the maximum amounts calculated under any applicable formula would be permitted. State insurance regulatory authorities that have jurisdiction over the payment of dividends by our insurance company subsidiary may in the future adopt statutory provisions, or impose additional constraints more restrictive than those currently in effect.
14
Investment Regulation
BICI is subject to Wisconsin laws that require diversification of our investment portfolios and prescribe limits on the kind, quality and concentration of investments. Failure to comply with these laws and regulations would cause nonconforming investments to be treated as non-admitted assets for purposes of measuring statutory surplus and, in some instances, would require us to sell those investments.
State Legislative and Regulatory Activity
From time to time, increased scrutiny has been placed upon the insurance regulatory framework, including licensing of employees, and a number of state legislatures have considered or enacted legislative measures that alter, and in many cases increase, state authority to regulate insurance companies. In addition to legislative initiatives of this type, insurance regulators and NAIC, a standard-setting association of state insurance regulators, are continuously involved in a process of reexamining existing laws and regulations and their application to insurance companies. The NAIC also establishes statutory accounting and reporting standards and drafts model insurance laws and regulations for adoption by the states.
As part of its solvency modernization efforts, the NAIC adopted the Risk Management and Own Risk and Solvency Assessment Model Act (the “ORSA Model Act”), which has been enacted in Wisconsin. The ORSA Model Act requires insurance companies to assess the adequacy of their and their group’s risk management and current and future solvency position. Under the ORSA Model Act, an insurer must undertake an internal risk management review no less often than annually (but also at any time when there are significant changes to the risk profile of the insurer or its insurance group), in accordance with the NAIC’s ORSA Guidance Manual, and prepare a confidential summary report (“ORSA Report”) assessing the adequacy of the insurer’s risk management and capital in light of its current and future business plans. The ORSA Report is filed with a company’s lead state regulator and is available to other domiciliary regulators within the holding company system.
Also, in furtherance of its solvency modernization efforts, the NAIC adopted the Corporate Governance Annual Disclosure Model Act and Model Regulation, which has been enacted in Wisconsin and requires an insurer to provide an annual disclosure regarding its corporate governance practices to its lead state and/or domestic regulator.
In addition, in December 2020, the NAIC adopted a group capital calculation tool (“GCC”) to provide U.S. regulators with a method to aggregate the available capital and the minimum capital of each entity in a group in a way that applies to all groups regardless of their structure. In connection with the GCC, the NAIC also adopted changes to the Insurance Holding Company System Regulatory Model Act and Regulation, which have been enacted in Wisconsin, to require, subject to certain exemptions, the ultimate controlling person of every insurer subject to the holding company registration requirement to file an annual GCC with its lead state. The GCC uses an RBC aggregation methodology for all entities within an insurance holding company system group, including non-U.S. entities.
Additionally, in response to the growing threat of cyber-attacks in the insurance industry, certain jurisdictions have begun to consider new cybersecurity measures, including the adoption of cybersecurity regulations which, among other things, would require insurance companies to establish and maintain a cybersecurity program and implement and maintain cybersecurity policies and procedures. On October 24, 2017, the NAIC adopted its Insurance Data Security Model Law, which has been enacted in Wisconsin, intended to serve as model legislation for states to enact in order to govern cybersecurity and data protection practices of insurers, insurance agents and other licensed entities registered under state insurance laws.
15
Federal Regulation
Although the federal government generally has not directly regulated the business of insurance except for certain areas of the market, such as insurance for flood, nuclear and terrorism risks, federal initiatives often affect the insurance industry in a variety of ways. The U.S. federal government’s oversight of the insurance industry was expanded under the Dodd-Frank Act, which, among other things, established the Federal Insurance Office (the “FIO”). The FIO performs various functions with respect to insurance, including the submission of reports to Congress that could ultimately lead to changes in the regulation of insurers and reinsurers in the U.S., although the FIO has no express regulatory authority over insurance companies or other insurance industry participants.
The Dodd-Frank Act also incorporated the Nonadmitted and Reinsurance Reform Act of 2010 (“NRRA”), which became effective on July 21, 2011, and establishes national uniform standards on how states may regulate and tax surplus lines insurance. In particular, the NRRA gives regulators in the home state of an insured exclusive authority to regulate and tax surplus lines insurance transactions. In August 2023, the NAIC adopted revisions to its Nonadmitted Insurance Model Act intended to implement the changes to the regulation of surplus lines insurance resulting from the NRRA.
In addition, a number of federal laws affect and apply to the insurance industry, including various privacy laws and the economic and trade sanctions implemented by the Office of Foreign Assets Control (“OFAC”) of the U.S. Department of the Treasury. OFAC maintains and enforces economic sanctions against certain foreign countries and groups and prohibits U.S. persons from engaging in certain transactions with certain persons or entities. OFAC has imposed civil penalties on persons, including insurance and reinsurance companies, arising from violations of its economic sanctions program.
Credit for Reinsurance
State insurance laws permit U.S. insurance companies, as ceding insurers, to take financial statement credit for reinsurance that is ceded, so long as the assuming reinsurer satisfies the state’s credit for reinsurance laws. In general, credit for reinsurance is allowed if the assuming reinsurer is licensed or “accredited” in the state in which the ceding insurer is domiciled or maintains certain types of qualifying collateral.
The FIO and the Office of the U.S. Trade Representative exercised their authority under the Dodd-Frank Act and entered into a “covered agreement” with the European Union, as well as a similar “covered agreement” with the United Kingdom, which established standards on collateral requirements for reinsurance, insurance group supervision and confidentiality. In 2019, the NAIC adopted amendments to its Credit for Reinsurance Model Law to implement the reinsurance collateral provisions of the covered agreements, eliminating reinsurance collateral requirements for qualifying reinsurers domiciled in jurisdictions subject to an in-force covered agreement. The amended Credit for Reinsurance Model Law, which has been adopted in all U.S. States, including Wisconsin, also extends the zero reinsurance collateral provisions in the covered agreements to qualified reinsurers that have been approved as a “certified reinsurer” or “reciprocal jurisdiction reinsurer” and to qualified reinsurers that are domiciled in a U.S. jurisdiction that is accredited by the NAIC or in a non-U.S. jurisdiction that has not entered into a covered agreement with the U.S. but which is designated as a “reciprocal jurisdiction” by the NAIC. The NAIC list of reciprocal jurisdictions includes Bermuda, Japan and Switzerland.
Periodic Financial and Market Conduct Examinations
The Wisconsin OCI, BICI’s domiciliary state insurance regulator, is authorized to conduct on-site visits and examinations of the affairs of BICI, including its financial condition, its relationships and transactions with affiliates and its dealings with policyholders, every three to five years, and may conduct special or targeted examinations to address particular concerns or issues at any time. Insurance regulators of other states in which we do business in the future also may conduct examinations. The results of these examinations can give rise to regulatory orders requiring remedial, injunctive or other corrective action. Insurance regulatory authorities have broad administrative powers to restrict or revoke licenses to transact business and to levy fines and monetary penalties against insurers and insurance agents and brokers found to be in violation of applicable laws and regulations.
16
Trade Practices
The manner in which insurance companies and insurance agents and brokers conduct the business of insurance is regulated by state statutes in an effort to prohibit practices that constitute unfair methods of competition or unfair or deceptive acts or practices. Prohibited practices include, but are not limited to, disseminating false information or advertising, unfair discrimination, rebating and false statements. We set business conduct policies and provide training to make our employee-producers aware of these prohibitions, and we require them to conduct their activities in compliance with these statutes.
Unfair Claims Practices
Generally, insurance companies, adjusting companies and individual claims adjusters are prohibited by state statutes from engaging in unfair claims practices on a flagrant basis or with such frequency to indicate a general business practice. Unfair claims practices include, but are not limited to, misrepresenting pertinent facts or insurance policy provisions; failing to acknowledge and act reasonably promptly upon communications with respect to claims arising under insurance policies; and attempting to settle a claim for less than the amount to which a reasonable person would have believed such person was entitled. We set business conduct policies and provide training to make our employee-producers aware of these prohibitions, and we require them to conduct their activities in compliance with these statutes.
Quarterly and Annual Financial Reporting
Our insurance company subsidiary is required to file quarterly and annual financial reports with state insurance regulators using SAP rather than U.S. GAAP. In keeping with the intent to assure policyholder protection, SAP emphasizes solvency considerations. For a summary of the significant differences for our insurance company subsidiary between SAP and U.S. GAAP, see Note 19, “Insurance – Statutory Information,” to our condensed consolidated financial statements included in this prospectus.
Risk-Based Capital
Risk-based capital (“RBC”) laws are designed to assess the minimum amount of capital that an insurance company needs to support its overall business operations and to ensure that it has an acceptably low expectation of becoming financially impaired. State insurance regulators use RBC to set capital requirements, considering the size and degree of risk taken by the insurer and taking into account various risk factors including asset risk, credit risk, underwriting risk and interest rate risk. As the ratio of an insurer’s total adjusted capital and surplus decreases relative to its risk-based capital, the RBC laws provide for increasing levels of regulatory intervention culminating with mandatory control of the operations of the insurer by the domiciliary insurance department at the so-called mandatory control level.
Wisconsin has largely adopted the model legislation promulgated by the NAIC pertaining to RBC, and requires annual reporting by Wisconsin-domiciled insurers to confirm that the minimum amount of RBC necessary for an insurer to support its overall business operations has been met. Wisconsin-domiciled insurers falling below a calculated threshold may be subject to varying degrees of regulatory action, including supervision, rehabilitation or liquidation by the Wisconsin OCI. Furthermore, BICI is required to maintain a ratio of total adjusted capital to authorized control level risk-based capital of not less than 400.0% under the Wisconsin OCI Stipulation and Order. Failure to maintain our risk-based capital at the required levels could adversely affect the ability of BICI to maintain the regulatory authority necessary to conduct our business. See “Risk Factors—We are subject to extensive regulation, which may adversely affect our ability to achieve our business objectives. In addition, if we fail to comply with these regulations, we may be subject to penalties, including fines, suspensions, revoking licenses, orders to cease and desist operations, and criminal prosecution, which may adversely affect our financial condition and results of operations.”
17
IRIS Ratios
The NAIC IRIS is part of a collection of analytical tools designed to provide state insurance regulators with an integrated approach to screening and analyzing the financial condition of insurance companies operating in their respective states. IRIS is intended to assist state insurance regulators in targeting resources to those insurers in greatest need of regulatory attention. IRIS consists of two phases: statistical and analytical. In the statistical phase, the NAIC database generates key financial ratio results based on financial information obtained from insurers’ annual statutory statements. The analytical phase is a review of the annual statements, financial ratios and other automated solvency tools. The primary goal of the analytical phase is to identify companies that appear to require immediate regulatory attention. A ratio result falling outside the usual range of IRIS ratios is not considered a failing result; rather, unusual values are viewed as part of the regulatory early monitoring system. Furthermore, in some years, it may not be unusual for financially sound companies to have several ratios with results outside the usual ranges. An insurance company may fall out of the usual range for one or more ratios because of specific transactions that are in themselves immaterial.
Human Capital
As of December 31, 2024, we employed 249 employees. Our employees are not subject to any collective bargaining agreements, and we are not aware of any current efforts to implement such an agreement.
Our employees are our most valuable assets. We embrace and encourage our employees’ differences in backgrounds, knowledge, life experiences and capabilities that we believe collectively play a significant role in our culture, reputation and achievements. We strive to cultivate an exceptional workforce to perpetuate our ownership culture and continue to achieve superior business results. Our goal is to attract, develop and retain the best talent, while promoting a fast-paced, results-driven team-centric environment. Our recruitment efforts focus on hiring high-quality, talented people wherever they live throughout the country. We believe that our talent-first approach to recruitment, irrespective of geographical location, is a competitive advantage that enables us to build cost effective teams while providing a high quality of life for our employees.
We offer and maintain a competitive benefits package designed to support the well-being of our employees, including, but not limited to, medical, dental and vision insurance; a 401(k) plan; paid time off; family leave; tuition reimbursement; and employee assistance programs. Our compensation is structured to align employee incentives with the long-term success, vision and direction of our organization. We also emphasize the training and development of our employees to help maximize their personal and professional growth with opportunities to further their education and careers.
We have a policy of entering into agreements with non-compete and/or non-solicitation provisions with certain key management personnel to protect our confidential information and customer goodwill as well as to minimize the risk of disruption to our business in the event of a key employee’s departure.
Available Information
The SEC maintains website at www.sec.gov that contains reports, proxy and information statements, and other information about the Company. In addition, our website, ir.bowheadspecialty.com, contains corporate governance information, including our Corporate Governance Guidelines, Code of Business Conduct and Ethics, and the charters of the Audit Committee and the Compensation, Nominating and Corporate Governance Committee of our Board of Directors. The information on, or that can be accessed through, our website is not incorporated by reference into this Annual Report on Form 10-K and is not part of this report.
ITEM 1A. RISK FACTORS
A description of the risks and uncertainties associated with our business is set for below. You should carefully consider the following information about these risks, together with the other information contained in this Annual Report on Form 10-K, including our financial statements and the notes thereto, and “Management’s Discussion and Analysis of Financial Condition and Results of Operations.” If any of the following risks actually occur, our business, financial condition or results of operations may be materially adversely affected. In such case, the trading price of our common stock could decline and you may lose all or part of your investment. Additional risks and
18
uncertainties not presently known to us or that we currently deem immaterial also may impair our business operations.
Risk Factors Summary
This summary provides an overview of the risks we face and should not be considered a substitute for the more fulsome risk factors discussed immediately following this summary.
Risks Related to Our Business and Industry
•Our financial condition and results of operations could be materially adversely affected if we do not accurately assess our underwriting risk.
•Competition for business in our industry is intense.
•Inability to maintain our strategic relationship with AmFam would materially adversely affect our business.
•A decline in AmFam’s financial strength rating or financial size category may adversely affect our financial condition and results of operations.
•Because our business depends on insurance retail agents, brokers and wholesalers, we are exposed to certain risks arising out of our reliance on these distribution channels that could adversely affect our results.
•We rely on a select group of brokers, and such relationships may not continue.
•We may be unable to continue purchasing third-party reinsurance in amounts we desire on commercially acceptable terms or on terms that adequately protect us, and this inability may materially adversely affect our business, financial condition and results of operations.
•Our losses and loss expense reserves may be inadequate to cover our actual losses, which could have a material adverse effect on our financial condition, results of operations and cash flows.
•Given the inherent uncertainty of risk assessment and underwriting tools and algorithms, the usefulness of such tools to evaluate risk is subject to a high degree of uncertainty that could result in actual losses that are materially different than our estimates. A deviation from our loss estimates may adversely impact, perhaps significantly, our financial results.
•We rely on third-party data, and inaccuracies in such data could adversely impact our ability to estimate losses and manage risks.
•Unexpected changes in the interpretation of our coverage or provisions, including loss limitations and exclusions, in our policies could have a material adverse effect on our financial condition and results of operations.
•Our reinsurers may not reimburse us for claims on a timely basis, or at all, which may materially adversely affect our business, financial condition and results of operations.
•While the P&C industry is generally currently experiencing a hard market, the insurance business is historically cyclical in nature, which may affect our financial performance and cause our operating results to vary from quarter to quarter and may not be indicative of future performance.
Risks Related to Laws and Regulation
•We are subject to extensive regulation, which may adversely affect our ability to achieve our business objectives. In addition, if we fail to comply with these regulations, we may be subject to penalties, including fines, suspensions, revoking licenses, orders to cease and desist operations and criminal prosecution, which may adversely affect our financial condition and results of operations.
19
•We may become subject to additional government or market regulation, which may have a material adverse impact on our business.
•Changes in law, including relating to certain perils, could adversely affect our business.
•Applicable insurance laws may make it difficult to effect a change of control.
Risks Related to Our Operations
•We could suffer security breaches, loss of data, cyberattacks and other information technology failures, and are subject to laws and regulations concerning data privacy and security that are continually evolving. Actual or suspected information technology failures or failure to comply with applicable law could disrupt our operations, damage our reputation and adversely affect our business, operations and financial results.
•Operational risk exposures, such as human or systems failures (including from third-party vendor arrangements), are inherent in our business and may result in losses.
•We may change our underwriting guidelines or our strategy without your approval.
•Any future acquisitions, strategic investments or new platforms could expose us to further risks or turn out to be unsuccessful.
•The effects of litigation on our business are uncertain and could have an adverse effect on our business.
•Loss of key vendor relationships or failure of a vendor to protect our data or confidential and proprietary information could affect our operations.
•Our limited operating history may make it difficult to evaluate our current business and future prospects.
Risks Related to Liquidity and Access to Capital
•We could be forced to sell investments to meet our liquidity requirements.
•Because we are a holding company and substantially all or a substantial portion of our operations are conducted by our insurance and service company subsidiaries, our ability to achieve liquidity at the holding company, including the ability to pay dividends and service our debt obligations, depends on our ability to obtain cash dividends or other permitted payments from our insurance and service company subsidiaries.
•We may require additional capital in the future, which may not be available or may only be available on unfavorable terms.
•Our failure to comply with the terms of our credit facility, including as a result of events beyond our control, could result in an event of default that could affect our business, financial condition, and results of operations.
•Our ability to incur a substantial level of indebtedness may reduce our financial flexibility, affect our ability to operate our business, and divert cash flow from operations for debt service.
Risks Related to Ownership of Our Common Stock
•Our costs have increased significantly as a result of operating as a public company, and our management is required to devote substantial time to complying with public company regulations.
•We qualify as an emerging growth company, and any decision on our part to comply with reduced reporting and disclosure requirements applicable to emerging growth companies could make our common stock less attractive to investors.
20
•GPC Fund and AFMIC exercise substantial influence over us, may engage in businesses that compete with us, and your ability to influence matters requiring stockholder approval may be limited.
Risks Related to Our Business and Industry
Our financial condition and results of operations could be materially adversely affected if we do not accurately assess our underwriting risk.
Our underwriting success depends on our ability to accurately assess the risks associated with the business we write and retain. We rely on the experience of our underwriting staff in assessing those risks. If we misunderstand the nature or extent of the risks, we may fail to establish appropriate premium rates or terms and conditions which could adversely affect our financial results. In addition, our employees, including members of management and underwriters, make decisions and choices in the ordinary course of business that involve exposing us to risk.
Competition for business in our industry is intense.
We face competition from other specialty insurance companies, standard insurance companies, managing general agencies (“MGAs”) and in some instances, decisions by potential insureds to self-insure if premiums are too high. Competition in the insurance industry is based on many factors, including price of coverage, general reputation and perceived financial strength of the company, relationships with distribution partners, terms and conditions of products offered, ratings assigned by independent rating agencies, speed of claims payment and reputation, and the experience and reputation of the members of our underwriting team in the particular lines of insurance we seek to underwrite. In recent years, the insurance industry has undergone some consolidation, which may further increase competition. The cost, capital and insurance synergies and combined underwriting leverage resulting from consolidation may mean a larger global insurer is able to compete more effectively and also may be more attractive than us to brokers and agents looking to place business. Larger insurers also may have lower operating costs and an ability to absorb greater risk while maintaining their financial strength ratings, thereby allowing them to price their products more competitively. If such competitive pressures reduce rates or negatively affect terms and conditions considerably, we may reduce our future underwriting activities in those lines thus resulting in reduced premiums and a potential reduction in expected earnings. Competitors may also have a longer operating history and more market recognition than we do in certain lines of business.
The rapid evolution of artificial intelligence (“AI”) and technology in general may alter the competitive landscape. While we expect to continue to leverage technology, data, and analytics efficiently, it is possible that competitors will leverage AI and technology solutions more effectively which may adversely impact our competitive position. Competitors could enter the insurance market and further accelerate these trends. Our competitive position could be adversely impacted if we are unable to deploy, in a cost effective and competitive manner, technology or if our competitors collect and use data which we do not have the ability or access to utilize. A number of new, proposed or potential industry or legislative developments could further increase competition in our industry. Additionally, the possibility of federal regulatory reform of the insurance industry could increase competition from standard carriers.
We may not be able to continue to compete successfully in the insurance markets. Increased competition in these markets could result in a change in the supply and demand for insurance and affect our ability to price our products at risk-adequate rates, retain existing business or underwrite new business on favorable terms. If increased competition limits our ability to transact business, our operating results could be adversely affected.
Inability to maintain our strategic relationship with AmFam would materially adversely affect our business.
As of December 31, 2024, AmFam owns approximately 14.4% of our common stock. We leverage AmFam’s legal entities, ratings and licenses through the MGA Agreements and the Quota Share Agreement. Through our MGA Agreements, BSUI underwrites premiums on behalf of the AmFam Issuing Carriers. Through the Quota Share Agreement, as of December 31, 2024, AmFam cedes 100.0% of this risk, along with the premiums to BICI and receives a ceding fee that is 2.0% on net premiums assumed. Separately, another AmFam subsidiary also negotiates reinsurance terms for its participation in our outward reinsurance program. Through our MGA Agreements, we also provide underwriting and claims handling services from BSUI to the AmFam Issuing Carriers. In essence, we
21
originate business on the paper of AmFam through BSUI writing policies issued by AmFam under the name of AmFam and reinsure 100.0% of the insurance business we originate to BICI, since we do not currently have the ratings to write policies under our own name and on our own paper. As a result, we rely on our strategic partnership with AmFam and any inability to maintain our strategic relationship with AmFam would materially adversely affect our business. These contractual arrangements may terminate or be terminated under certain circumstances and there can be no assurance that this strategic relationship will continue in the future, including on the same or similar terms, and if not, that we would be able to find a suitable replacement or another strategic partnership on favorable terms if at all. In the event that the MGA Agreements were terminated and we were not able to find another carrier with similar financial strength ratings with which we could partner, our ability to write new and renewal business would be significantly impacted as the amount of business we could write directly on BICI paper without BICI having its own standalone financial strength rating from A.M. Best would be de minimis. See “––We may require additional capital in the future, which may not be available or may only be available on unfavorable terms.”
A decline in AmFam’s financial strength rating or financial size category may adversely affect our financial condition and results of operations.
Participants in the insurance industry use ratings from independent ratings agencies, such as A.M. Best, as an important means of assessing the financial strength and quality of insurers. In setting its ratings, A.M. Best performs quantitative and qualitative analyses of a company’s balance sheet strength, operating performance and business profile. A.M. Best financial strength ratings range from “A++” (Superior) to “F” for insurance companies that have been publicly placed in liquidation.
We do not currently have a standalone A.M. Best rating for BICI. However, our strategic partner, AmFam and the AmFam Issuing Carriers, have an “A” (Excellent) financial strength rating and a XV financial size category from A.M. Best as of December 31, 2024. A downgrade or withdrawal of AmFam’s financial strength rating or reduction in its financial size category could result in any of the following consequences, among others:
•causing current and future distribution partners and insureds to choose other competitors; or
•severely limiting or preventing the writing of new and renewal insurance contracts.
A.M. Best’s analysis includes comparisons to peers and industry standards as well as assessments of operating plans, philosophy and management. A.M. Best periodically reviews AmFam’s financial strength rating and may revise it upward or downward at its discretion based primarily on its analyses of AmFam’s balance sheet strength, operating performance and business profile.
In addition, in view of the earnings and capital pressures experienced by many financial institutions, including insurance companies, it is possible that rating organizations will heighten the level of scrutiny that they apply to such institutions, increase the frequency and scope of their credit reviews, request additional information from the companies that they rate, or increase the capital and other requirements employed in the rating organizations’ models for maintenance of certain ratings levels.
We anticipate that we will continue to leverage our strategic relationship with AmFam for lines of business that require an “A” financial strength rating from A.M. Best and any downgrade or withdrawal of AmFam’s rating could have a material adverse effect on our business. A.M. Best assigns ratings that are intended to provide an independent opinion of an insurance company’s ability to meet its obligations to policyholders and is not an evaluation directed to investors and is not a recommendation to buy, sell or hold stock or any other securities an insurance group may issue.
Because our business depends on insurance retail agents, brokers and wholesalers, we are exposed to certain risks arising out of our reliance on these distribution channels that could adversely affect our results.
Substantially all of our products are ultimately distributed through independent retail agents and brokers who have the principal relationships with policyholders. Retail agents and brokers generally own the “renewal rights,” and thus our business model depends on our relationships with, and the success of, the retail agents and brokers with
22
whom we do business. Further, we also depend on the relationships our wholesalers maintain with the agents and brokers from whom they source their business.
Our relationship with our retail agents, brokers and wholesalers may be discontinued at any time, subject to the terms of the respective producer agreements and applicable regulatory requirements. Even if the relationships do continue, they may not be on terms that are profitable for us. For example, as insurance distribution firms continue to consolidate, their ability to influence commission rates may increase as may the concentration of business we have with a particular broker. Consolidation of distributors may also increase the likelihood that distributors will try to renegotiate the terms of existing selling agreements to terms less favorable to us. Further, certain premiums from policyholders, where the business is produced by brokers, are collected directly by the brokers and remitted to us. In certain jurisdictions, when the insured pays its policy premiums to its broker for payment on behalf of our insurance company subsidiary, the premiums may be considered to have been paid under applicable insurance laws and regulations. Accordingly, the insured would no longer be liable to us for those amounts, whether or not we have actually received the premium from that broker. Consequently, we assume a degree of credit risk associated with the brokers with which we work. Although the failure by any of our brokers to remit premiums to us has not been material to date, there may be instances where our brokers collect premiums but do not remit them to us and we may be required under applicable law to provide the coverage set forth in the policy despite the related premiums not being paid to us. Similarly, if we are limited in our ability to cancel policies for non-payment, our underwriting profits may decline and our financial condition and results of operations could be materially and adversely affected. Also, if insurance distribution firm consolidation continues at its current pace or increases in the future, our sales channels could be materially affected in a number of ways, including loss of market access or market share in certain geographic areas. Specifically, we could be negatively affected due to loss of talent as the people most knowledgeable about our products and with whom we have developed strong working relationships exit the business following an acquisition or increases in our commission costs as larger distributors acquire more negotiating leverage over fees. Any such disruption that materially affects our sales channel could have a negative impact on our financial condition and results of operations.
We periodically review the agencies, brokers and wholesalers with whom we do business to identify those that do not meet our profitability standards, are not aligned with our business objectives or do not comply with applicable laws and regulations. Following these periodic reviews, we may restrict such distributors’ access to certain types of products or terminate our relationship with them, subject to applicable contractual and regulatory requirements that limit our ability to terminate agents or require us to renew policies. Even through the utilization of these measures, we may not achieve the desired results.
Because we rely on these distributors as our sales channel and for some additional services that we receive from these distributors, any deterioration in the relationships with our distributors or failure to provide competitive compensation could lead our distributors to place more premium with other carriers and less premium with us. In addition, we could be adversely affected if the distributors with which we do business exceed their granted authority, fail to transfer collected premium to us, breach the obligations that they owe to us or fail to perform such additional services. Although we routinely monitor our distribution relationships, such actions could expose us to liability.
As the speed of digitization accelerates, we are subject to risks associated with both our distributors and their ability to keep pace. In an increasingly digital world, distributors who cannot provide a digital or technology-driven experience risk losing customers who demand such an experience, and such customers may choose to do business with more technology-driven distributors.
We rely on a select group of brokers, and such relationships may not continue.
We distribute the majority of our products through a select group of brokers. For the twelve months ended December 31, 2024, 68.3%, or $475.0 million, of our gross written premiums were distributed through four of our approximately 65 brokers.
Our relationship with any of these brokers may be discontinued at any time, subject to the terms of the respective producer agreements and applicable regulatory requirements. Even if the relationships do continue, they may not be on terms that are profitable for us. Consolidation could impact relationships with, and fees paid to, some
23
agents and brokers. If brokers merge with or acquire each other, there could be a resulting failure or inability of brokers to market our products successfully or the loss of a substantial portion of the business sourced by one or more of our key brokers. The termination of a relationship with one or more significant brokers could result in lower gross written premiums and could have a material adverse effect on our results of operations or business prospects.
We may be unable to continue purchasing third-party reinsurance in amounts we desire on commercially acceptable terms or on terms that adequately protect us, and this inability may materially adversely affect our business, financial condition and results of operations.
We strategically purchase reinsurance from third parties which enhances our business by protecting capital from severity events (either large single event losses or catastrophes) and reducing volatility in our earnings. Reinsurance involves transferring, or ceding, a portion of our risk exposure on policies that we write to another insurer, the reinsurer, in exchange for a cost. If we are unable to renew our expiring contracts, enter into new reinsurance arrangements on acceptable terms or expand our coverage, our loss exposure could increase, which would increase our potential losses related to loss events. If one of our reinsurers changes its strategic plan and is no longer actively writing new business on a going forward basis, it may become more difficult to obtain new reinsurance arrangements on favorable terms. If we are unwilling to bear an increase in loss exposure, we may need to reduce the level of our underwriting commitments, which could materially adversely affect our business, financial condition and results of operations.
There are situations in which reinsurers may exclude certain coverages from, or alter terms in, the reinsurance contracts we enter into with them. As a result, we, like other insurance companies, could write insurance policies which to some extent do not have the benefit of reinsurance protection. These gaps in reinsurance protection expose us to greater risk and greater potential losses.
We may also write risks that do not fall within the coverage provided by our reinsurance contracts, or we may purchase types of reinsurance that inadequately cover our risks, and in such an event, we may be exposed to greater risk and greater potential losses.
Our losses and loss expense reserves may be inadequate to cover our actual losses, which could have a material adverse effect on our financial condition, results of operations and cash flows.
Our success depends on our ability to assess the risks related to the businesses and people that we insure accurately. We establish losses and loss adjustment expense reserves for the best estimate of the ultimate payment of all claims that have been incurred, or could be incurred in the future, and the related costs of adjusting those claims, as of the date of our financial statements. Reserves do not represent an exact calculation of liability. Rather, reserves represent an estimate of what we expect the ultimate settlement and administration of claims will cost us based on information available at that time, and our ultimate liability may be greater or less than our estimate.
As part of the reserving process, we use similar processes for assessing the risks related to our business written on an admitted basis and on a non-admitted basis and thus this is generally not a variable that affects our estimates. In each case, we both review our historical data, which is limited given our short operating history, and industry data that is available to us from actuarial consultants and other publicly available sources, as well as consider the impact of such factors as:
•claims inflation, which is the sustained increase in cost of raw materials, labor, medical services and other components of claims cost;
•claims development patterns by line of business, as well as frequency and severity trends;
•pricing for our products;
•legislative activity;
•social and economic patterns; and
•litigation, judicial and regulatory trends.
24
These variables are affected by both internal and external events that could increase our exposure to losses, and we continually monitor our loss reserves using new information on reported claims and a variety of statistical techniques and modeling simulations. Most or all of these factors are not directly quantifiable, particularly on a prospective basis. It is possible that we may make underwriting decisions based on incorrect or incomplete information. If inadequate or inaccurate information is provided to us, we may misunderstand the nature or extent of the activities or facilities and the corresponding extent of the risks that we insure. Further, this process assumes that past experience, adjusted for the effects of current developments, anticipated trends and market conditions, is an appropriate basis for predicting future events. There is, however, no precise method for evaluating the impact of any specific factor on the adequacy of loss reserves and actual results may deviate, perhaps substantially, from our reserve estimates. For instance, the following uncertainties may have an impact on the adequacy of our reserves:
•When a claim is received, it may take considerable time to appreciate fully the extent of the covered loss suffered by the insured and, consequently, estimates of loss associated with specific claims can increase over time. Consequently, estimates of loss associated with specified claims can change as new information emerges, which could cause the reserves for the claim to become inadequate.
•New theories of liability are enforced retroactively from time to time by courts. See “—Unexpected changes in the interpretation of our coverage or provisions, including loss limitations and exclusions, in our policies could have a material adverse effect on our financial condition and results of operations.”
•Volatility in the financial markets, economic events and other external factors may result in an increase in the number of claims and/or severity of the claims reported. In addition, elevated inflationary conditions, among other things, cause loss costs to increase. See “—Adverse economic factors, including recession, inflation, periods of high unemployment or lower economic activity could result in the sale of fewer policies than expected or an increase in frequency of claims and premium defaults, and even the falsification of claims, or a combination of these effects, which, in turn, could affect our growth and profitability.”
•If claims were to become more frequent, even if we had no liability for those claims, the cost of evaluating such potential claims could escalate beyond the amount of the loss adjustment expense reserves we have established. As we enter into new lines of business, or as a result of new theories of claims, we may encounter an increase in claims frequency and greater claims handling costs than we had anticipated.
If any of our reserves should prove to be inadequate, we will be required to increase our reserves resulting in a reduction in our net income and total mezzanine equity and stockholders’ equity in the period in which the deficiency is identified. Future loss experience substantially in excess of established reserves could also have a material adverse effect on our future earnings and liquidity.
Given the inherent uncertainty of risk assessment and underwriting tools and algorithms, the usefulness of such tools to evaluate risk is subject to a high degree of uncertainty that could result in actual losses that are materially different than our estimates. A deviation from our loss estimates may adversely impact, perhaps significantly, our financial results.
Our approach to risk management relies on subjective variables that entail significant uncertainties. In addition, we rely on historical data and scenarios in managing risks in our investment portfolio. The estimates, tools, data and algorithms that we use to estimate losses and manage risks may not produce accurate predictions and consequently, we could incur losses both in the risks we underwrite and to the value of our investment portfolio.
We use proprietary underwriting tools, which we refer to as BRATs, for the lines in which we write business, which are further supplemented with customized third-party data. Our key business leaders leverage their respective BRATs to evaluate submissions and, over time, have built line of business-specific capabilities, capturing exposures and drivers of the losses that are relevant to each submission. Each of our three “craft” underwriting divisions has their own unique set of BRATs. Each BRAT stores data in our core operating system for each submission, regardless of whether we ultimately write the account. The Professional Liability BRAT data is supplemented by third-party vendor data integrated directly into its algorithms. We use these BRATs across departments during our underwriting process to evaluate each risk. However, given the inherent uncertainty of underwriting tools and
25
algorithms and the application of such techniques, these tools, algorithms and databases may not accurately address a variety of matters which may impact certain of our coverages. These tools may be inadequate representations of the underlying subject matter, including as a result of inaccurate inputs or evaluations of data (resulting from data error, human error or otherwise). Consequently, actual losses from loss events, whether from individual claims or in the aggregate, may differ materially from modeled expectations. If, based upon these tools, models or other factors, we misprice our products or underestimate the frequency and/or severity of loss events, our profitability, financial condition, or liquidity may be adversely affected.
Small changes in assumptions, which depend heavily on our judgment and foresight, can have a significant impact on the outputs of BRATs and other tools we use. These assumptions address a number of factors that impact loss potential; and these factors vary considerably across lines of business and specific BRATs. Examples include, but are not limited to: business class, industry classifications or areas of practice or operations; company financial condition; stock price volatility; insured investment strategies; company policies and procedures; distribution and volatility of expected claim amounts; future trends in claim severity and frequency; expected development of historical paid and reported claims; and regulatory and judicial environment associated with insured location or venue. Furthermore, there are risks which are either poorly represented or not represented at all by our BRATs or other tools and algorithms. These uncertainties can include, but are not limited to, the following:
•the tools do not address all the possible hazard characteristics;
•the tools may not accurately represent loss potential to insurance or reinsurance contract coverage limits, terms and conditions; and
•the tools may not accurately reflect economic, financial, judicial, political, or regulatory impact on insurance claim payments.
The outputs from the BRATs and other tools we use, together with other qualitative and quantitative assessments, are used in our underwriting process to evaluate risk. Our methodology for estimating losses may differ from methods used by other companies and external parties given the various assumptions and judgments required.
As a result of these factors and contingencies, our reliance on assumptions, tools and data we use is subject to a high degree of uncertainty that could result in actual losses that are materially different from our estimates and our financial results could be adversely affected.
We rely on third-party data, and inaccuracies in such data could adversely impact our ability to estimate losses and manage risks.
Due to our limited operating history, we have generated limited amounts of our own data and instead must rely on data from third parties. We use data from third parties in our BRATs and other underwriting tools as part of our underwriting process to evaluate risks and estimate losses. We rely on these third parties to ensure that the data they provide is accurate. Inaccurate data could affect our ability to effectively estimate losses, resulting in actual losses that are materially different from our estimates, which could have an adverse impact on our business, financial condition and results of operations.
26
Unexpected changes in the interpretation of our coverage or provisions, including loss limitations and exclusions, in our policies could have a material adverse effect on our financial condition and results of operations.
Loss limitations or exclusions in our policies may not be enforceable in the manner we intend. Changes in legal, judicial, social and other external conditions beyond our control can cause unexpected and unintended issues related to claims and coverage. For example, there may be policy provisions for which no judicial precedent interpreting the policy language exists. For matters of first impression, judicial interpretations can vary widely depending on jurisdictional and judicial factors, and often take several years to work through subsequent appellate channels to reach final judgment on the interpretation of such language. Additionally, it is possible that legislative or regulatory bodies may target a specific exclusion or limitation of coverage rendering the provision unenforceable or to be interpreted in a manner inconsistent with the intent of the insurer. In addition, court decisions could read policy exclusions narrowly so as to expand coverage, thereby requiring insurers to create and write new exclusions. For example, a January 2022 ruling from a court in New Jersey, which was upheld by the appellate court, denied the applicability of war exclusions with respect to nation-state-led cyber attacks and permitted a large global healthcare company to recover under certain of its insurance policies for a ransomware attack. Such actions could result in higher than anticipated losses and loss adjustment expenses, which could have a material adverse effect on our financial condition and results of operations.
These issues may adversely affect our business by either broadening coverage beyond our underwriting intent or by increasing the frequency or severity of claims. In some instances, these changes may not become apparent until some time after we have issued insurance contracts that are affected by the changes. As a result, the full extent of liability under our insurance contracts may not be known for many years after a contract is issued.
Outward reinsurance is a key part of our strategy, subjecting us to the credit risk of our reinsurers and may not be available, affordable or adequate to protect against losses.
Outward reinsurance is a key part of our strategy, and our outward reinsurance protection may not be sufficient for all eventualities, which could expose us to greater risk and greater potential loss, which could in turn have a material adverse effect on our business, financial condition, results of operations and prospects. In particular, if a number of large losses occur in any one year, there is a chance that we could exhaust our outward reinsurance. In this event, it is not certain that further reinsurance coverage would be available on acceptable terms, or at all, for the remainder of that year or for future years which could materially increase the risks and losses we retain. Additionally, changes in reinsurer’s risk appetite may have an impact on the availability of reinsurance on commercially reasonable terms, or at all. We are unable to predict how reinsurer’s risk appetite may fluctuate in the future.
Collectability of reinsurance depends on the solvency of reinsurers and their willingness to make payments under the terms of reinsurance agreements. In particular, we can be exposed to non-coterminous wording risk under such agreements, including interpretations by our reinsurers that they may withhold payment for losses. As such, the terms and conditions of the reinsurance purchased by us may not provide precise coverage for the losses we incur on the underlying insurance or reinsurance which we have sold. While all of our reinsurers are currently highly rated, their ratings could be downgraded in the future. Finally, a material deterioration in the capital levels of our reinsurance counterparties may reduce the amount of statutory capital relief provided by our reinsurance arrangements, which could result in our failure to meet our own statutory capital requirements. A reinsurer’s insolvency or inability or unwillingness to make payments under the terms of a reinsurance arrangement could have a material adverse effect on our business, financial condition, results of operations and prospects.
Our reinsurers may not reimburse us for claims on a timely basis, or at all, which may materially adversely affect our business, financial condition and results of operations.
The reinsurance contracts into which we enter to help manage our risks require us to pay premiums to the reinsurance carriers who will in turn reimburse us for a portion of covered policy claims. In many cases, a reinsurer will be called upon to reimburse us for policy claims many years after we paid insurance premiums to the insurer. Although reinsurance makes the reinsurer liable to us to the extent the risk is transferred or ceded to the reinsurer, it
27
does not relieve us (the ceding insurer) of our primary liability to our policyholders. Our current reinsurance program is designed to limit our financial risk. However, our reinsurers may not pay claims we incur on a timely basis, or they may not pay some or all of these claims. For example, reinsurers may default in their financial obligations to us as the result of insolvency, lack of liquidity, operational failure, political and/or regulatory prohibitions, fraud, asserted defenses based on agreement wordings or the principle of utmost good faith, asserted deficiencies in the documentation of agreements, or other reasons. In addition, if reinsurers consolidate, such reinsurers’ willingness to pay claims in the same timely manner as prior to such consolidation may change. Any disputes with reinsurers regarding coverage under reinsurance contracts could be time consuming, costly and uncertain of success. These risks could cause us to incur increased net losses, and, therefore, adversely affect our financial condition. As of December 31, 2024, we had $255.1 million of aggregate reinsurance recoverables; 100% of these reinsurance recoverables were derived from reinsurers currently with an “A” (Excellent) financial strength rating from A.M. Best, or better.
We may act based on inaccurate or incomplete information regarding the accounts we underwrite.
We rely on information provided by insureds or their representatives when underwriting insurance policies. While we may make inquiries to validate or supplement the information provided, we may make underwriting decisions based on incorrect or incomplete information. It is possible that we will misunderstand the nature or extent of the activities or facilities and the corresponding extent of the risks that we insure because of our reliance on inadequate or inaccurate information.
Our failure to accurately and timely pay claims could materially and adversely affect our business, financial condition, results of operations and prospects.
We must accurately and timely evaluate and pay claims that are made under our policies. Many factors affect our ability to pay claims accurately and timely, including the training and experience of our claims representatives, the effectiveness of our management, and our ability to develop or select and implement appropriate procedures and systems to support our claims functions and other factors. Our failure to pay claims accurately and timely could lead to regulatory and administrative actions or material litigation, including bad faith claims, undermine our reputation in the marketplace and materially and adversely affect our business, financial condition, results of operations and prospects.
Excessive risk taking could negatively affect our financial condition and business.
As an insurance enterprise, we are in the business of binding certain risks. The employees who conduct our business, including executive officers and other members of management, underwriters and other employees, do so in part by making decisions and choices that involve exposing us to risk. These include decisions, such as setting underwriting guidelines and standards, product design and pricing, determining which business opportunities to pursue and other decisions. We endeavor, in the design and implementation of our compensation programs and practices, to avoid giving our employees incentives to take excessive risks. Employees may, however, take such risks regardless of the structure of our compensation programs and practices. Similarly, although we employ controls and procedures designed to monitor employees’ business decisions and prevent them from taking excessive risks, these controls and procedures may not be effective. If our employees take excessive risks, the impact of those risks could have a material adverse effect on our financial condition, results of operations and business.
In addition, while we generally do not delegate underwriting and binding authority, we do distribute an insurance product through a program administrator in connection with a risk purchasing group to whom we have issued a master policy. See “Business—Marketing and Distribution” for additional information. While this program administrator is contractually obligated to follow our underwriting guidelines, it can issue individual certificates of insurance to policyholders without receiving our approval for each individual risk. If this program administrator takes excessive risks and fails to comply with our underwriting guidelines and the terms of its appointment, we could be bound on a particular risk or number of risks that were not anticipated when we developed the insurance product or estimated our potential losses and loss adjustment expenses. Such actions and excessive risk taking by the program administrator could adversely affect our results of operations.
28
If actual renewals of our existing contracts do not meet expectations, our gross written premiums in future years and our future results of operations could be materially adversely affected.
In our financial forecasting process, we make assumptions about the rates of renewal of our existing contracts. The insurance and reinsurance industries have historically been cyclical businesses with intense competition, often based on price. If actual renewals do not meet expectations or if we choose not to write renewals because of pricing conditions or terms, our gross written premiums in future years and our future operations could be materially adversely affected.
Cyber threats are an evolving risk area affecting not only the specific cyber insurance market but also the liability coverage we provide which may adversely affect us.
We have introduced processes to manage our potential liabilities as a result of specific cyber coverage and other coverage we provide to our policyholders. However, given that cyber is an area where the threat landscape is uncertain and continuing to evolve, there is a risk that increases in the frequency and effectiveness of cyberattacks on our policyholders could adversely affect (possibly to a material extent) our business, financial condition, results of operations and prospects. This risk also depends on the measures the individual policyholders use to protect themselves to keep pace with the emerging threat, as well as the development and issuance of policy terms and conditions which are reactive to the evolving threat landscape.
Changes in accounting practices and future pronouncements may materially affect our reported financial results and business.
Various authoritative accounting or regulatory entities, including the Financial Accounting Standards Board (“FASB”) and the SEC may amend, expand and/or eliminate the financial accounting or reporting standards that govern the preparation of our consolidated financial statements or could reverse their previous interpretations or positions on how various financial accounting and/or reporting standards should be applied. Various FASB and SEC proposals are pending and such proposals are subject to change. Developments in accounting practices may require us to incur considerable additional expenses to comply, particularly if we are required to prepare information relating to prior periods for comparative purposes or to apply the new requirements retroactively. The impact of changes in current accounting practices and future pronouncements cannot be predicted but may affect the calculation of net income, total mezzanine equity and stockholders’ equity and other relevant financial statement line items.
BICI is required to comply with the Statutory Accounting Principles (“SAP”). SAP and various components of SAP are subject to constant review by the NAIC and its task forces and committees, as well as state insurance departments, in an effort to address emerging issues and otherwise improve financial reporting. Various proposals are pending before committees and task forces of the NAIC, some of which, if enacted and adopted on a state level, could have negative effects on insurance industry participants. The NAIC continuously examines existing laws and regulations. We cannot predict whether or in what form such reforms will be enacted and, if so, whether the enacted reforms will positively or negatively affect us.
In addition, the NAIC Accounting Practices and Procedures manual provides that state insurance departments may permit insurance companies domiciled therein to depart from SAP by granting them permitted accounting practices. We cannot predict whether or when the insurance departments of the states of domicile of our competitors may permit them to utilize advantageous accounting practices that depart from SAP, the use of which is not permitted by the Wisconsin OCI, the insurance regulator of the state of domicile of BICI. We can give no assurance that future changes to SAP or components of SAP or the grant of permitted accounting practices to its competitors will not have a negative impact on us.
We may not be able to effectively start up or integrate new product opportunities.
Our ability to grow our business depends, in part, on our development, implementation or acquisition of new insurance products that are profitable and fit within our risk appetite and business model. New product launches such as environmental coverages through our Casualty division or our Baleen Specialty division, as well as resources to integrate business acquisitions, are subject to many obstacles, including ensuring we have sufficient
29
business and systems processes, determining appropriate pricing, obtaining reinsurance, assessing opportunity costs and regulatory burdens and planning for internal infrastructure needs. If we cannot accurately assess and overcome these obstacles or we improperly implement new insurance products, our ability to grow profitably will be impaired.
Adverse economic factors, including recession, inflation, periods of high unemployment or lower economic activity could result in the sale of fewer policies than expected or an increase in the frequency of claims and premium defaults, and even the falsification of claims, or a combination of these effects, which, in turn, could affect our growth and profitability.
Factors, such as business revenue, economic conditions, the volatility and strength of the capital markets, trade disputes, including the imposition of new or increased tariffs, and inflation can affect the business and economic environment. These same factors affect our ability to generate revenue and profits. In an economic downturn that is characterized by higher unemployment, declining spending and reduced corporate revenue, the demand for insurance products is generally adversely affected, which directly affects our premium levels and profitability. Negative economic factors may also affect our ability to receive the appropriate rate for the risk we insure with our policyholders and may adversely affect the number of policies we can write, and our opportunities to underwrite profitable business. In an economic downturn, our customers may have less need for insurance coverage, cancel existing insurance policies, modify their coverage or not renew the policies they hold with us. Existing policyholders may exaggerate or even falsify claims to obtain higher claims payments. In addition, if certain segments of the economy, such as the construction segments, were to significantly change, it could adversely affect our results. These outcomes would reduce our underwriting profit to the extent these factors are not reflected in the rates we charge. Given our limited operating history, we have not experienced the inflationary impacts on our claims or investments that many other insurance companies may have experienced with respect to historical losses or investment portfolios with longer histories. However, given the recent inflationary pressures, we seek to set our rates at a level which we believe will reflect the anticipated impacts of inflation. In addition, certain lines of business, including our Excess Projects and Primary Projects lines of business within our Casualty division, have seen fewer projects commence as a result of recent inflationary pressures. The impact of inflation is generally felt most in policies with longer durations and where the claims take a longer time to settle. Policies written on an occurrence form do see claims being notified under policies that were written years ago; the delay between the policy period and the notification of claims exposes us to the impact of inflation. Another way we are affected is by the length of time between the claim being notified and the claim being paid. A multi-year construction project with a period built in to report construction defects may be more exposed to inflation than a Cyber ransomware attack where the claim notice may be made almost immediately and the claim may be settled in months. As a general matter, casualty claims take longer to develop than claims for property insurance, which we do not currently write, and as a result, the impacts of inflation on casualty claims is generally greater than on property claims.
While the P&C industry is generally currently experiencing a hard market, the insurance business is historically cyclical in nature, which may affect our financial performance and cause our operating results to vary from quarter to quarter and may not be indicative of future performance.
Historically, insurance carriers have experienced significant fluctuations in operating results due to competition, frequency and severity of catastrophic events, levels of capacity, adverse litigation trends, regulatory constraints, general economic conditions and other factors. The supply of insurance is related to prevailing prices, the level of insured losses and the level of capital available to the industry that, in turn, may fluctuate in response to changes in rates of return on investments being earned in the insurance industry. As a result, the insurance business historically has been a cyclical industry characterized by periods of intense price competition due to excessive underwriting capacity (soft market cycle) as well as periods when shortages of capacity increased premium levels (hard market cycle). Demand for insurance depends on numerous factors, including the frequency and severity of catastrophic events, levels of capacity, the introduction of new capital providers and general economic conditions. All of these factors fluctuate and may contribute to price declines generally in the insurance industry.
Although an individual insurance company’s financial performance depends on its own specific business characteristics, the profitability of most P&C companies tends to follow this cyclical market pattern with higher gross written premium growth and improved profitability during hard market cycles. Further, this cyclical market pattern can be more pronounced in the E&S market than in the standard insurance market. When the standard
30
insurance market hardens, the E&S market typically hardens, and growth in the E&S market can be significantly more rapid than growth in the standard insurance market. Similarly, when conditions begin to soften, many customers that were previously driven into the E&S market may return to the admitted market, exacerbating the effects of rate decreases on our financial results.
While the P&C industry is currently in an overall hard market cycle and it has been reported that the P&C market has been hard for the past several years, our business lines may not be affected equally. We believe current conditions have more strongly affected our Casualty division, compared to our Healthcare Liability division which is experiencing more mixed conditions across its business lines and our Professional Liability division which has seen some softening of rates, particularly in risk management and public directors and officers line of business including financial institutions, after a couple years of significant rate increases.
We cannot predict the timing or duration of changes in the market cycle because the cyclicality is due in large part to the actions of our competitors and general economic factors. As a result, our operating results are subject to fluctuation due to a number of factors, including the general economic conditions in the markets where we operate, the frequency of occurrence or severity of catastrophe or other insured events, fluctuating interest rates, claims exceeding our loss reserves, competition in our industry, deviations from expected premium retention rates of our existing policies and contracts, adverse investment performance and the cost of reinsurance coverage.
Performance of our investment portfolio is subject to a variety of investment risks that may adversely affect our financial results.
Our results of operations depend, in part, on the performance of our investment portfolio. We seek to maintain a diversified portfolio of fixed income investments that is managed by a third-party investment management firm, NEAM, which is a wholly-owned subsidiary of Berkshire Hathaway Inc., in accordance with our investment policy and strategy that is reviewed and approved by our board of directors on a regular basis. However, our investments are subject to general economic conditions, volatility and market risks as well as risks inherent to specific securities. Our primary market risk exposures are to changes in interest rates and credit spreads. See “Management’s Discussion and Analysis of Financial Condition and Results of Operations—Quantitative and Qualitative Disclosures about Market Risk.”
Our investment portfolio consists almost entirely of cash, cash equivalents and investment-grade fixed-income securities. Although interest rates have slightly decreased recently, they have increased significantly since 2021.As rate increases cease or decline, a lower interest rate environment could place pressure on our net investment income, particularly as it relates to these securities and short-term investments, which, in turn, may adversely affect our results of operations. Conversely, increases in interest rates could cause the values of our fixed income securities portfolios to decline, with the magnitude of the decline depending on the duration of securities included in our portfolio and the amount by which interest rates increase. Some fixed income securities have call or prepayment options, which create possible reinvestment risk in declining rate environments. Other fixed income securities, such as mortgage-backed and asset-backed securities, carry prepayment risk, or, in a rising interest rate environment, may not prepay as quickly as expected.
All of our fixed maturity securities are subject to credit risk. Credit risk is the risk that certain investments may default or become impaired due to deterioration in the financial condition of one or more issuers of the securities we hold, or due to deterioration in the financial condition of an insurer that guarantees an issuer’s payments on such investments. Downgrades in the credit ratings of fixed maturity securities (where rated) could also have a significant negative effect on the market valuation of such securities.
The above market and credit risks could reduce our net investment income and result in realized investment losses. Our investment portfolio is subject to increased valuation uncertainties when investment markets are illiquid. The valuation of investments is more subjective when markets are illiquid, thereby increasing the risk that the estimated fair value (i.e., the carrying amount) of the securities we hold in our portfolio do not reflect prices at which actual transactions would occur.
31
Risks for all types of securities are managed through the application of our investment policy, which establishes investment parameters that include, but are not limited to, allocation of investment in certain types of securities, duration targets and minimum levels of credit quality, which we believe are within applicable guidelines established by the NAIC and comply with Wisconsin insurance laws and regulations governing investments.
Although we seek to preserve our capital, we cannot be certain that our investment objectives will be achieved, and results may vary substantially over time. In addition, although we seek to employ investment strategies that are not correlated with our insurance and reinsurance exposures, losses in our investment portfolio may occur at the same time as underwriting losses and, therefore, exacerbate the adverse effect of the losses on us.
Pandemics, geopolitical and social events, severe weather conditions, including the effects of climate change and catastrophes, as well as man-made event events may adversely affect our business, results of operations and financial condition.
Our business is exposed to the risk of pandemics, outbreaks, public health crises and geopolitical and social events, including cyber warfare, and their related effects. Notwithstanding policy terms and conditions intended to preclude certain coverage for virus-related claims, court decisions and governmental actions may challenge the validity of any exclusions or our interpretation of how such terms and conditions operate. Courts have already challenged the applicability of war exclusions with respect to nation-state-led cyber attacks. If pandemics, outbreaks or geopolitical and other events occur or re-occur, our business, financial condition, results of operations and cash flows may be materially adversely affected.
In addition, although we do not currently write property insurance, our insureds are exposed to the risk of severe weather conditions, earthquakes and man-made catastrophes. Catastrophes can be caused by various events, including natural events such as severe winter weather, tornadoes, windstorms, earthquakes, hailstorms, severe thunderstorms and fires, or man-made events such as explosions, war, terrorist attacks and riots. Over the past several years, changing weather patterns and climatic conditions, such as global warming, have added to the unpredictability and frequency of natural disasters in certain parts of the world, including the markets in which we operate. Climate change may increase the frequency and severity of extreme weather events. This effect has led to conditions in the ocean and atmosphere, including warmer-than-average sea-surface temperatures and low wind shear that increase hurricane activity. The occurrence of a natural disaster could materially adversely affect our business, financial condition and results of operations. Additionally, any increased frequency and severity of such weather events, including hurricanes, may have unanticipated impacts on our insureds and therefore could have a material adverse effect on our ability to predict, quantify, reinsure and manage risk and may materially increase our losses resulting from such events.
Risks Related to Laws and Regulation
We are subject to extensive regulation, which may adversely affect our ability to achieve our business objectives. In addition, if we fail to comply with these regulations, we may be subject to penalties, including fines, suspensions, revoking licenses, orders to cease and desist operations and criminal prosecution, which may adversely affect our financial condition and results of operations.
Regulatory authorities in the states or countries in which our operating subsidiaries conduct business may require individual or company licensing to act as producers, brokers, agents, third-party administrators, managing general agents, reinsurance intermediaries, or adjusters. Insurance is required to be written through licensed agents and brokers. Under the laws of most states in the United States, regulatory authorities have relatively broad discretion with respect to granting, renewing and revoking producers’, brokers’ and agents’ licenses to transact business in such state. The operating terms may vary according to the licensing requirements of the particular state, which may require that a firm operate in the state through a local corporation. Our subsidiaries must comply with laws and regulations of the jurisdictions in which they do business. In states in which we operate on a non-admitted basis, surplus lines brokers generally are required to certify that a certain number of licensed admitted insurers had been offered and declined to write a particular risk prior to placing that risk with us or that the coverage is otherwise unavailable from an admitted carrier.
32
Our insurance company subsidiary, BICI, is subject to extensive regulation in Wisconsin, its state of domicile, and to a lesser degree, any other states in which it may operate. Most insurance regulations are designed to protect the interests of insurance policyholders, as opposed to the interests of investors or stockholders. These regulations generally are administered by a department of insurance in each state and relate to, among other things, capital and surplus requirements, investment and underwriting limitations, affiliate transactions, dividend limitations, changes in control, solvency and a variety of other financial and non-financial aspects of our business. Significant changes in these laws and regulations, or how insurance departments interpret and enforce such laws and regulations, could further limit our discretion or make it more expensive to conduct our business. State insurance regulators also conduct periodic examinations of the affairs of insurance and reinsurance companies and require the filing of annual and other reports relating to financial condition, holding company issues and other matters. These regulatory requirements may impose timing and expense constraints that could adversely affect our ability to achieve some or all of our business objectives.
We are subject to the insurance holding company laws of Wisconsin, which require BICI to register with the Wisconsin OCI and furnish information concerning the operations of companies within the holding company system that may materially affect the operations, management or financial condition of BICI. These statutes also provide that all transactions among members of a holding company system must be fair and reasonable and, if material or of specified types, such transactions require prior notice and approval or non-disapproval by the Wisconsin OCI. These prior notification and approval requirements may result in business delays and additional business expenses. If we fail to comply with such requirements or fail to comply with other applicable insurance regulations in Wisconsin, we may be subject to fines and penalties imposed by the Wisconsin OCI.
In addition, individual states may impose different requirements on an insurance company’s ability to cancel a policy which may extend the period during which we are exposed to risk for a policy or individual states may have differing interpretations of contractual language or require specific wordings which may also expose us to additional risk. Individual states may also prohibit certain types of insurance which could limit the lines of business we may be able to write and adversely affect our ability to achieve some or all of our business objectives.
State insurance regulators also have broad discretion to suspend, deny or revoke licenses for various reasons, including the violation of regulations. In some instances, where there is uncertainty as to applicability, we follow practices based on our interpretations of regulations or practices that we believe generally to be followed by the industry. These practices may turn out to be different from the interpretations of regulatory authorities. If we do not have the requisite licenses and approvals or do not comply with applicable regulatory requirements, state insurance regulators could preclude or temporarily suspend us from carrying on some or all of our activities in their state or could otherwise penalize us. This could adversely affect our ability to operate our business. Further, changes in the level of regulation of the insurance industry or changes in laws or regulations themselves or interpretations by regulatory authorities could interfere with our operations and require us to bear additional costs of compliance, which could adversely affect our ability to operate our business.
State insurance regulators require insurance companies to maintain specified levels of statutory capital and surplus. Insurance regulators have broad powers to prevent reduction of statutory surplus to inadequate levels. BICI is subject to risk-based capital requirements and other minimum capital and surplus restrictions imposed under Wisconsin law. Wisconsin has largely adopted the model legislation promulgated by the NAIC pertaining to risk-based capital. These requirements establish the minimum amount of risk-based capital necessary for a company to support its overall business operations. It identifies P&C insurers that may be inadequately capitalized by looking at certain inherent risks of each insurer’s assets and liabilities and its mix of net written premium. Insurers falling below a calculated threshold may be subject to varying degrees of regulatory action, including supervision, rehabilitation or liquidation. In addition to these requirements under Wisconsin law, BICI is also subject to certain surplus and risk-based capital requirements under a company-specific stipulation and order from the Wisconsin OCI (the “Wisconsin OCI Stipulation and Order”). Pursuant to the Wisconsin OCI Stipulation and Order, BICI is required to (i) have a compulsory surplus equal to the greater of (A) $3.0 million or (B) the sum of (x) 50.0% of gross written premiums for medical malpractice insurance (which business is written as part of our Healthcare Liability division) and (y) 20.0% of gross written premiums for all other covered lines of insurance, (ii) maintain surplus in excess of its required security surplus standard under Wisconsin law and (iii) maintain a ratio of total adjusted capital to authorized control level risk-based capital of not less than 400.0%. See “Regulation—Restrictions
33
on Paying Dividends” for additional information. Failure to maintain surplus and risk-based capital at the required levels could adversely affect the ability of BICI to maintain the regulatory authority necessary to conduct our business. In addition, state surplus lines laws, or laws pertaining to non-admitted insurance business, require that surplus lines brokers comply with diligent search/exempt commercial purchaser laws and affidavit/document filing requirements, as well as requiring the collection and paying of any taxes, stamping fees, assessment fees and other applicable charges on such business. E&S businesses, such as the Company, are often subject to special licensing, surplus lines tax and/or due diligence requirements by the home state of the insured. Fines for failing to comply with these surplus lines requirements, specifically for failing to comply with the surplus lines licensing or due diligence requirements, vary by state but can range to several million dollars.
In addition, the NAIC has developed the IRIS, which is part of a collection of analytical tools designed to provide state insurance regulators with an integrated approach to screening and analyzing the financial condition of insurance companies operating in their respective states. IRIS is intended to assist state insurance regulators in targeting resources to those insurers in greatest need of regulatory attention. IRIS consists of two phases: statistical and analytical. In the statistical phase, the NAIC database generates key financial ratio results based on financial information obtained from insurers’ annual statutory statements. The analytical phase is a review of the annual statements, financial ratios and other automated solvency tools. The primary goal of the analytical phase is to identify companies that appear to require immediate regulatory attention. A ratio result falling outside the usual range of IRIS ratios is not considered a failing result; rather, unusual values are viewed as part of the regulatory early monitoring system. Insurance regulators will generally begin to investigate, monitor or make inquiries of an insurance company if four or more of the company’s ratios fall outside the usual ranges. Although these inquiries can take many forms, regulators may require the insurance company to provide additional written explanation as to the causes of the particular ratios being outside of the usual range, the actions being taken by management to produce results that will be within the usual range in future years and what, if any, actions have been taken by the insurance regulator of the insurers’ state of domicile. Regulators are not required to take action if an IRIS ratio is outside of the usual range, but depending upon the nature and scope of the particular insurance company’s exception (for example, if a particular ratio indicates an insurance company has insufficient capital) regulators may act to reduce the amount of insurance the company can write or revoke the insurer’s certificate of authority and may even place the company under supervision.
We may become subject to additional government or market regulation, which may have a material adverse impact on our business.
Our business could be adversely affected by changes in state laws, including those relating to asset and reserve valuation requirements, surplus requirements, limitations on investments and dividends, enterprise risk and risk-based capital requirements, the use of new technology (i.e. artificial intelligence), and, at the federal level, by laws and regulations that may affect certain aspects of the insurance industry, including proposals for preemptive federal regulation. The U.S. federal government generally has not directly regulated the insurance industry except for certain areas of the market, such as insurance for flood, nuclear and terrorism risks. However, the federal government has undertaken initiatives or considered legislation in several areas that may affect the insurance industry, including tort reform, corporate governance and the taxation of reinsurance companies. Further, Dodd-Frank gives the Federal Reserve supervisory authority over certain U.S. financial services companies, including insurance companies, if they are designated as 'systemically important' by a two-thirds vote of a Financial Stability Oversight Council. Although we do not currently believe that we are systemically important, as defined in Dodd-Frank, Dodd-Frank or additional federal or state regulation potentially adopted in the future could impose significant burdens on us, impact how we conduct our business and govern our subsidiaries, increase compliance costs, increase the requisite levels of capital needed to operate our subsidiaries, duplicate state regulation, and/or result in a competitive disadvantage.
We are unable to predict whether any future legislation will be enacted or future regulations adopted, or the effect any such developments may have on our business, financial condition, or profitability.
34
Changes in law, including relating to certain perils, could adversely affect our business.
A change in law, including relating to certain perils for which we write insurance or reinsurance, may have a significant impact on our ability to respond to certain events, including the manner and time frame for processing claims, the development of claim severity or the interpretation of the underlying policies. For example, plaintiff attorneys have been lobbying states to pass statutes prohibiting insurers from issuing defense within limits policies, particularly in the medical malpractice space, and Nevada has enacted a statute to that effect. If such a statute were to pass in a jurisdiction in which we operate, that would impede our ability to accurately price such policies. In addition, the statute of limitations for certain types of claims have been extended in certain states, such as New York through the Adult Survivors Act, and this could retroactively extend the period for which an insurance company has exposure. Changes in law and practice, including relating to certain perils for which we write insurance or reinsurance, may have a material adverse effect on our business, financial condition, results of operations and prospects.
Applicable insurance laws may make it difficult to effect a change of control.
Under applicable U.S. state insurance laws and regulations (including the laws of the state of Wisconsin), before a person can acquire control of a U.S. domestic insurer, prior written approval must be obtained from the insurance commissioner of the state where the insurer is domiciled, or the acquiror must request an Exemption Request or file a disclaimer of affiliation and/or control (a “Disclaimer”) with the insurance department of such state and obtain approval thereon. Such approval would be contingent upon the state insurance commissioner’s consideration of a number of factors, including among others, the financial strength of the proposed acquiror, the integrity and management of the acquiror’s board of directors and executive officers, the acquiror’s plans for the future operations of the domestic insurer, and any anti-competitive results that may arise from the consummation of the acquisition of control. Wisconsin insurance laws and regulations pertaining to changes of control would apply to both the direct and indirect acquisition of ten percent or more of the voting stock of a Wisconsin-domiciled insurer (or of less than ten percent of the voting stock if there is other indicia of control). Accordingly, the acquisition of ten percent or more of our common stock would be considered an indirect change of control of BICI and would trigger the applicable change of control filing requirements under Wisconsin insurance laws and regulations, absent the filing of an Exemption Request or Disclaimer and its acceptance by the Wisconsin OCI. These requirements may discourage potential acquisition proposals and may delay, deter or prevent a change of control of us, including through transactions that some or all of our stockholders might consider to be desirable.
Risks Related to Our Operations
We could be adversely affected by the loss of one or more key personnel or by an inability to attract and retain qualified personnel, including failure to develop a succession plan for Stephen Sills, our founder and Chief Executive Officer, or other members of our senior management team.
We depend on our ability to attract and retain experienced and seasoned personnel who are knowledgeable about our business. Our senior management team, including our founder and Chief Executive Officer, Stephen Sills, plays an important role in our strategic direction, product development, broker partnership, corporate culture and our continued success as an organization. While we generally do not enter into employment agreements with our executive officers and other key personnel, we have entered into an employment agreement with Stephen Sills, however, Stephen Sills may terminate his agreement after the third anniversary of our initial public offering on at least 90 days’ notice. The loss of Stephen Sills or other members of our senior management team could materially adversely impact our business.
We could be adversely affected if we fail to adequately plan for the succession of our senior leaders and key executives. Our current succession plans and employment arrangements with certain key executives do not guarantee their services will continue to be available to us.
The pool of talent from which we actively recruit is limited and may fluctuate based on market dynamics specific to our industry and independent of overall economic conditions. As such, higher demand for employees having the desired skills and expertise could lead to increased compensation expectations for existing and prospective personnel, making it difficult for us to retain and recruit key personnel and maintain labor costs at
35
desired levels. To protect our confidential information and customer goodwill as well as to minimize the risk of disruption to our business in the event of a departure, our key employees, including our executive officers, are subject to non-compete and non-solicitation provisions that generally apply during, and extend for six to twelve months following the termination of, their employment; although, not all jurisdictions permit such non-compete agreements, and regardless of the jurisdiction, our key personnel could still pursue employment opportunities with other parties, including, with any of our competitors and there are no assurances that our non-compete agreements with any such key personnel would be enforceable in a cost effective manner, if at all. Should any of our key personnel terminate their employment with us, or if we are unable to retain and attract talented personnel, we may be unable to maintain our current competitive position in the specialized markets in which we operate, which could adversely affect our results of operations.
We could suffer security breaches, loss of data, cyberattacks and other information technology failures, and are subject to laws and regulations concerning data privacy and security that are continually evolving. Actual or suspected information technology failures or failure to comply with applicable law could disrupt our operations, damage our reputation and adversely affect our business, operations and financial results.
As a company with a remote-friendly operating model, our business is highly dependent on our information technology and telecommunications systems, including our underwriting systems. We rely on these systems to interact with brokers and insureds, to underwrite business, to prepare policies and process premiums, to perform actuarial and other modeling functions, to process claims and make claims payments and to prepare internal and external financial statements. We also rely on our information and telecommunications systems for employees to interact with each other within the company, as most employees work on a remote basis a majority of their time as opposed to in physical offices. Some of these systems may include or rely on third-party systems provided by third party service providers and/or not located on our premises or under our control.
We and our service providers face numerous and evolving cybersecurity risks that threaten the confidentiality, integrity and availability of systems and confidential information, including vulnerabilities that could be exploited by threat actors in commercial software that is integrated into our (or our suppliers’ or service providers’) IT systems, products or services. The risk of a data security breach or a disruption has generally increased in frequency, intensity and sophistication. Techniques used to compromise or sabotage systems change frequently, may originate from less regulated and remote areas of the world and be difficult to detect and generally are not recognized until launched against a target. Events such as natural catastrophes, terrorist attacks, industrial accidents, computer viruses, ransomware, a security breach by an unauthorized person, employee error, malfeasance, faulty password management or other irregularity and other cyber-attacks may cause our systems to fail or be inaccessible for extended periods of time. We have implemented management, operational, and technical security controls designed to identify, protect, detect, respond to and recover from breaches of security, such as business contingency plans and other reasonable plans to protect our systems, whether housed internally or through third-party cloud services. In addition, while we generally monitor vendor risk, including the security and stability of our critical vendors, we may fail to properly assess and understand the risks and costs involved in the third-party relationships. However, we cannot guarantee that these measures will be effective and sustained or repeated system failures or service denials could severely limit our ability to write and process new and renewal business, provide customer service, pay claims in a timely manner or otherwise operate in the ordinary course of business. Even if the vulnerabilities that may lead to the foregoing are identified, we may be unable to adequately investigate or remediate due to attackers using tools and techniques that are designed to circumvent controls, avoid detection and remove or obfuscate forensic evidence.
As have many companies, we, and our third-party service providers, have been impacted by breaches in the past and will likely continue to experience cybersecurity incidents of varying degrees. Any such event may result in operational disruptions as well as unauthorized access to, the disclosure of, or loss of our proprietary information or our customers’ data and information, which in turn may result in legal claims, regulatory scrutiny and liability, reputational damage, the incurrence of costs to eliminate or mitigate further exposure, an increase in our annual cybersecurity insurance premiums, the loss of customers or affiliated advisors, or other damage to our business. In addition, the trend toward general public notification of such incidents could exacerbate the harm to our business, financial condition and results of operations. Even if we successfully protect our technology infrastructure and the confidentiality of sensitive data, we could suffer harm to our business and reputation if attempted security breaches are publicized. We cannot be certain that advances in criminal capabilities, discovery of new vulnerabilities,
36
attempts to exploit vulnerabilities in our systems, data thefts, physical system or network break-ins, inappropriate access, or other developments will not compromise or breach the technology or other security measures protecting the networks and systems used in connection with our business.
In addition, as part of our normal business activities, we handle information related to individuals including, but not limited to, employees, claimants, individual third-party brokers or agents and individual vendors. As such, we are subject to various federal, state and local laws, regulations and industry standards. The regulatory environment surrounding information security and privacy is increasingly demanding, with frequent imposition of new and changing requirements that are subject to differing interpretations. In the United States, there are numerous federal and state data privacy and security laws, rules and regulations governing the collection, use, storage, sharing, transmission and other processing of personal information, including federal and state data privacy laws, data breach notification laws and consumer protection laws.
Any failure or perceived failure by us to comply with laws, regulations, policies or regulatory guidance relating to privacy or data security may result in governmental investigations and enforcement actions, litigation, fines and penalties or adverse publicity, and could cause our customers and consumers to lose trust in us, which could have an adverse effect on our reputation and business.
Operational risk exposures, such as human or systems failures (including from third-party vendor arrangements), are inherent in our business and may result in losses.
Operational exposures and losses can result from, among other things, errors, failure to document transactions properly or to obtain proper internal authorization, failure to comply with regulatory requirements, information technology failures, bad faith delayed claims payment, fraud and external events, such as political unrest, state emergency or industrial actions which could result in operational outage. Any such outage could have a material adverse effect on our business, financial condition, results of operations or prospects.
We also rely on third parties for information technology and application systems and infrastructure. Such information technology and application systems and infrastructure are an important part of our underwriting process and our ability to compete successfully. We also license certain of our key systems and data from third parties and cannot be certain that we will have continuous access to such third-party systems and data, or those of comparable service providers, or that our information technology or application systems and infrastructure will operate as intended. Further, the third parties’ programs and systems may be subject to defects, failures, material updates, or interruptions, including those caused by worms, viruses or power failures.
Failures in any of these systems could result in mistakes made in the confirmation or settlement of transactions, or in transactions not being properly booked, evaluated, priced or accounted for or delays in the payment of claims. Any such eventuality could cause us to suffer, among other things, financial loss, disruption of business, liability to third parties, regulatory intervention and reputational damage, any of which could have a material adverse effect on our business, financial condition, results of operations, or prospects.
We may change our underwriting guidelines or our strategy without your approval.
Our management has the authority to change our underwriting guidelines or our strategy without notice to our stockholders and without stockholder approval. As a result, we may make fundamental changes to our operations without stockholder approval, which could result in our pursuing a strategy or implementing underwriting guidelines that may be materially different from the strategy or underwriting guidelines described in the section entitled “Business” or elsewhere in this Annual Report on Form 10-K.
We may not be able to manage our growth effectively.
We intend to grow our business in the future, which could require additional capital, systems development and skilled personnel. However, we must be able to meet our capital needs, expand our systems and our internal controls effectively, allocate our human resources optimally, identify, hire, train and develop qualified employees and effectively incorporate the components of any business we may acquire in our effort to achieve growth. The failure
37
to manage our growth effectively could have a material adverse effect on our business, financial condition and results of operations.
Any future acquisitions, strategic investments or new platforms could expose us to further risks or turn out to be unsuccessful.
From time to time, we may pursue growth through acquisitions and strategic investments in businesses or new underwriting or marketing platforms. The negotiation of potential acquisitions or strategic investments as well as the integration of an acquired business, personnel or underwriting or marketing platforms could result in a substantial diversion of management resources and the emergence of other risks, such as potential losses from unanticipated litigation, a higher level of claims than is reflected in reserves, loss of key personnel in acquired businesses or an inability to generate sufficient revenue to offset acquisition costs.
Our ability to manage our growth through acquisitions, strategic investments or new or alternative platforms, such as our Baleen Specialty division, will depend, in part, on our success in addressing such risks. While we are not currently contemplating any such acquisitions or strategic investments, our nimble approach to capital management based on opportunities presented and sought out means that we may opportunistically from time to time pursue such acquisitions, new platforms or strategic investment strategies. Any failure by us to implement our acquisitions, new platforms or strategic investment strategies effectively could have a material adverse effect on our business, financial condition, results of operations and prospects.
The effects of litigation on our business are uncertain and could have an adverse effect on our business.
As is typical in our industry, we continually face risks associated with litigation of various types, including disputes relating to insurance claims under our policies, disputes with our reinsurers, as well as other general commercial and corporate litigation. Litigation and other proceedings may also include complaints from or litigation by customers or reinsurers related to alleged breaches of contract or otherwise. Although we are not currently involved in any out-of-the-ordinary litigation with our customers, reinsurers or our current or former employees, other members of the insurance industry are the target of class action lawsuits and other types of litigation, including employment-related litigation, some of which involve claims for substantial or indeterminate amounts, and the outcomes of which are unpredictable. This litigation is based on a variety of issues, including insurance and claim settlement practices. If we were to be involved in litigation and it was determined adversely, it could require us to pay significant damage amounts or to change aspects of our operations, either of which could have a material adverse effect on our financial results. We are also subject to various contingencies. For example, we may owe certain employment taxes, penalties and interests related to 2021, 2022, 2023, and certain employment taxes for 2024 for an employee domiciled in the United Kingdom. While we have accrued certain amounts representing our best estimate of taxes, interests and penalties owed, such accruals may be insufficient and we may be subject to additional charges. Even claims without merit can be time-consuming and costly to defend and may divert management’s attention and resources away from our business and adversely affect our business, results of operations and financial condition. Additionally, routine lawsuits over claims that are not individually material could in the future become material if aggregated with a substantial number of similar lawsuits. In addition to increasing costs, a significant volume of customer complaints or litigation could adversely affect our brand and reputation, regardless of whether such allegations are valid or whether we are liable. Accordingly, we cannot predict with any certainty whether we will be involved in such litigation in the future or what impact such litigation would have on our business.
Loss of key vendor relationships or failure of a vendor to protect our data or confidential and proprietary information could affect our operations.
We rely on services and products provided by many vendors in the United States and abroad. These include, for example, vendors of computer hardware and software and vendors and/or outsourcing of services such as human resource benefits management services and investment management services. In the event that any vendor suffers a bankruptcy or otherwise becomes unable to continue to provide products or services, or fails to protect our confidential, proprietary, or other information, we may suffer operational impairments and financial losses. In addition, while we generally monitor vendor risk, including the security and stability of our critical vendors, we may
38
fail to properly assess and understand the risks and costs involved in the third-party relationships, and our financial condition and results of operations could be materially and adversely affected.
We anticipate that we will continue to rely on third-party software in the future. Although we believe that there are commercially reasonable alternatives to the third-party software we currently license, this may not always be the case, or it may be difficult or costly to replace. In addition, integration of new third-party software may require significant work and require substantial investment of our time and resources. Our use of additional or alternative third-party software would require us to enter into license agreements with third parties, which may not be available on commercially reasonable terms or at all. Many of the risks associated with the use of third-party software cannot be eliminated, and these risks could negatively affect our business.
We may fail or be unable to protect our intellectual property rights, which could adversely affect our brand and business.
Our success and ability to compete depend in part on our intellectual property, which includes our rights in our brand and our proprietary technology used in certain of our product lines. We primarily rely on trademarks, copyrights and trade secret laws, as well as contractual restrictions in our confidentiality and license agreements with our employees, customers, service providers, partners and other third parties with which we have a relationship, to protect our intellectual property rights. However, the steps we take to protect our intellectual property may be inadequate. Our efforts to enforce our intellectual property rights may be met with defenses, counterclaims and countersuits attacking the validity and enforceability and scope of our intellectual property rights. Our failure to secure, protect and enforce our intellectual property rights could adversely affect our brand and adversely impact our business. These agreements may not adequately secure our intellectual property rights and may be breached, and we may not have adequate remedies for such breach. While we use reasonable efforts to protect our trade secrets, our employees, customers, service providers and other third parties with which we have a relationship may unintentionally or willfully disclose our proprietary information to competitors.
Our limited operating history may make it difficult to evaluate our current business and future prospects.
We founded our business in September 2020. Our limited operating history may make it difficult for you to evaluate our current business and our future prospects. We have encountered and will continue to encounter risks and difficulties frequently experienced by growing companies in rapidly changing industries, including increasing and unforeseen expenses as we continue to grow our business. If we do not manage these risks successfully, our business may be harmed. Further, we may be subject to claims by third parties alleging that we are infringing, misappropriating or otherwise violating their intellectual property rights. Any litigation or claims, whether or not valid, could result in substantial costs, negative publicity and diversion of resources and management attention.
Risks Related to Liquidity and Access to Capital
We could be forced to sell investments to meet our liquidity requirements.
We invest the premiums we receive from our insureds until they are needed to pay policyholder claims. Consequently, we seek to manage the duration of our investment portfolio based on the duration of our losses and loss adjustment expense reserves to provide sufficient liquidity and avoid having to liquidate investments to fund claims. Risks such as inadequate losses and loss adjustment expense reserves, unfavorable trends in litigation, or mismanagement of the investment portfolio’s duration or other liquidity needs could potentially result in the need to sell investments to fund these liabilities. We may not be able to sell our investments at favorable prices or at all. Sales could result in significant realized losses depending on the conditions of the general market, interest rates and credit issues with individual securities.
39
Because we are a holding company and substantially all or a substantial portion of our operations are conducted by our insurance and service company subsidiaries, our ability to achieve liquidity at the holding company, including the ability to pay dividends and service our debt obligations, depends on our ability to obtain cash dividends or other permitted payments from our insurance and service company subsidiaries.
The continued operation and growth of our business will require substantial capital. Accordingly, we do not intend to declare and pay cash dividends on shares of our common stock in the foreseeable future. See “Dividend Policy.” Because we are a holding company with no substantial business operations of our own, our ability to pay dividends to stockholders and meet our debt payment obligations is largely dependent on dividends and other distributions from BICI and our other operating companies. BICI’s ability to pay dividends is restricted under the insurance laws and regulations of its domiciliary state and may only be paid from unassigned surplus. Under the insurance laws of Wisconsin, an insurer may make an ordinary dividend payment if its surplus as regards to policyholders, following such dividend, is reasonable in relation to its outstanding liabilities, is adequate to its financial needs, and does not exceed the insurer’s unassigned surplus. See “Regulation—Restrictions on Paying Dividends” for additional information. State insurance regulators require insurance companies to maintain specified levels of statutory capital and surplus. Insurance regulators have broad powers to prevent reduction of statutory surplus to inadequate levels, and there is no assurance that dividends of the maximum amounts calculated under any applicable formula would be permitted. Moreover, state insurance regulatory authorities that have jurisdiction over the payment of dividends by our insurance company subsidiary may in the future adopt statutory provisions, or impose additional constraints on BICI, more restrictive than those currently in effect.
Any determination to pay dividends in the future will be at the discretion of our board of directors and will depend upon our financial condition, results of operations, capital requirements, general business conditions, legal, tax and regulatory limitations, contractual restrictions and other factors that our board of directors considers relevant. Consequently, in order for investors to realize any future gains on their investment, they may need to sell all or part of their holdings of our common stock after price appreciation, which may never occur.
We may require additional capital in the future, which may not be available or may only be available on unfavorable terms.
Our future capital requirements depend on many factors, including our ability to write new business successfully and to establish premium rates and reserves at levels sufficient to cover losses. To the extent that the cash flows provided by our operating activities and investing activities are insufficient to fund future operating requirements and cover claim losses, we may need to raise additional funds through financings or curtail our growth. Many factors will affect the amount and timing of our capital needs, including our growth rate and profitability, our claims experience, the availability of reinsurance, market disruptions and other unforeseeable developments. If we need to raise additional capital, equity or debt financing may not be available at all or may be available only on terms that are not favorable to us. In the case of equity financings, dilution to our stockholders could result. In the case of debt financings, we may be subject to covenants that restrict our ability to freely operate our business. In any case, such securities may have rights, preferences and privileges that are senior to those of the shares of common stock offered hereby. In addition, because BICI is considered an affiliate of AFMIC under Wisconsin insurance regulations and BICI’s business is currently comprised solely of business assumed from AFMIC, BICI’s regulatory capital requirements are lower. BICI’s regulatory capital requirements under Wisconsin’s insurance regulations would be higher if BICI’s business was assumed from an insurance company that was not an affiliate of BICI or was written directly with our policyholders. If BICI were to no longer qualify as an affiliate of AFMIC, additional capital would be required in order for BICI to meet its regulatory capital requirements under Wisconsin insurance regulations. If we cannot obtain adequate capital on favorable terms or at all, we may not have sufficient funds to implement our operating plans and our business, financial condition or results of operations could be materially adversely affected.
40
Our failure to comply with the terms of our credit facility, including as a result of events beyond our control, could result in an event of default that could affect our business, financial condition, and results of operations.
The Company has a Credit Agreement (the “Credit Agreement”) with certain lenders and JPMorgan Chase Bank, N.A., as administrative agent, swingline lender and issuing bank. The Credit Agreement provides for a senior secured revolving credit facility (the “Facility”) in the aggregate principal amount of $75 million, which includes a 5 million sub-facility for letters of credit. If there were an event of default under the Facility, the lenders under the Facility could cause all amounts outstanding with respect to that debt to be due and payable immediately. Our assets or cash flow may not be sufficient to fully repay borrowing under the Facility if accelerated upon an event of default. Furthermore, if we are unable to repay, refinance, or restructure our Facility, the lenders under the Facility could proceed against the collateral granted to them to secure such indebtedness, which could force us into bankruptcy or liquidation. As a result, any default by us on our debt could have a materially adverse effect on our business, financial condition, and results of operations.
Our ability to incur a substantial level of indebtedness may reduce our financial flexibility, affect our ability to operate our business, and divert cash flow from operations for debt service.
As of December 31, 2024, we had no outstanding indebtedness, and $75.0 million of undrawn availability, under the Facility.
We may incur substantial indebtedness under the Facility or other debt instruments in the future, and, if we do so, the risks related to our level of indebtedness could increase. Our future borrowings will require interest payments and will need to be repaid or refinanced, which could require us to divert funds identified for other purposes to debt service and could create additional cash demands or impair our liquidity position and add financial risk. We may also sell additional debt or equity securities to help repay or refinance our borrowings. We do not know whether we would be able to take any of these actions on a timely basis, on terms satisfactory to us or at all.
Our future level of indebtedness could affect our operations in several ways, including but not limited to the following:
•increase our vulnerability to changes in general economic, industry, and competitive conditions;
•require us to dedicate a portion of our cash flow to make payments on our indebtedness, thereby reducing the availability of our cash flow to fund other corporate purposes;
•place us at a competitive disadvantage compared to our competitors that are less leveraged and therefore potentially more able to take advantage of opportunities that our level of indebtedness would prevent us from pursuing; and
•impair our ability to obtain additional financing in the future.
Borrowings under the Facility bear interest at variable rates based on prevailing conditions in the financial markets, and changes to such variable market rates may affect both the amount of cash we must pay for interest as well as our reported interest expense. Assuming the Facility were to be fully drawn, a 100-basis point increase to the applicable variable rate of interest would increase the amount of interest expense by $0.75 million per annum. If we are unable to generate sufficient cash flows to pay the interest expense on our debt, future working capital, borrowings, or equity financing may not be available from which to pay or refinance such debt.
In addition, if any of the financial institutions that provide loan commitments to us were to fail, our liquidity could be adversely impacted and we may not be able to obtain financing for working capital, capital expenditures, acquisitions, and other purposes. In such event, our ability to operate and compete effectively, and our ability to execute on our growth strategies, could be adversely affected, which in turn would have an adverse impact on our business, results of operations and financial condition.
41
The Facility contains restrictions on our ability to operate our business and to pursue our business strategies.
The Facility restricts, subject to certain exceptions, among other things, our ability and the ability of our subsidiaries to:
•incur additional indebtedness and guarantee indebtedness;
•prepay, redeem, or repurchase certain debt;
•create or incur liens;
•make investments and loans;
•pay dividends or make other distributions, in respect of, or repurchase or redeem, capital stock;
•engage in mergers, consolidations, or sales of all or substantially all of our assets;
•sell or otherwise dispose of assets;
•amend, modify, waive, or supplement certain subordinated indebtedness to the extent such amendments would be materially adverse to the interests of the lenders; and
•engage in certain transactions with affiliates.
Any future financing arrangements entered into by us or any of our subsidiaries may contain similar restrictions or maintenance covenants. As a result of these covenants and restrictions, we and our subsidiaries are, and will be, limited in how we conduct our business, and we may be unable to raise additional debt or equity financing to compete effectively or to take advantage of new business opportunities. The terms of any future indebtedness we or our subsidiaries may incur could include more restrictive covenants. We cannot guarantee that we will be able to maintain compliance with these covenants in the future and, if we fail to do so, that we will be able to obtain waivers from the lenders and/or amend the covenants.
Risks Related to Ownership of Our Common Stock
Our costs have increased significantly as a result of operating as a public company, and our management is required to devote substantial time to complying with public company regulations.
As a public company, we have incurred and expect to continue to incur significant legal, accounting and other expenses that we did not incur as a private company. We are subject to the reporting requirements of the Securities Exchange Act of 1934 (the “Exchange Act”), which requires, among other things, that we file with the SEC annual, quarterly and current reports with respect to our business and financial condition and therefore we need to have the ability to prepare financial statements that comply with all SEC reporting requirements on a timely basis. In addition, we are or will be subject to other reporting and corporate governance requirements, including certain requirements of and certain provisions of the Sarbanes-Oxley Act and the regulations promulgated thereunder, which impose significant compliance obligations upon us. In particular, we must perform system and process evaluation and testing of our internal control over financial reporting to allow management and, to the extent that we are no longer an “emerging growth company” as defined in the Jumpstart Our Business Startups Act of 2012 (the “JOBS Act”), our independent registered public accounting firm to report on the effectiveness of our internal control over financial reporting, as required by Section 404 of the Sarbanes-Oxley Act. Our compliance with Section 404 requires that we incur substantial accounting expense and expend significant management efforts.
The Sarbanes-Oxley Act and the Dodd-Frank Act, as well as related rules subsequently implemented by the SEC and the New York Stock Exchange (the “NYSE”), have increased regulation of, and imposed enhanced disclosure and corporate governance requirements on, public companies. Our efforts to comply with these evolving laws, regulations and standards will increase our operating costs and divert management’s time and attention from revenue-generating activities. Further, if these laws, regulations and rules were to change substantially in the future, we might be unable to meet new requirements.
42
These obligations place significant additional demands on our finance and accounting staff and on our financial accounting and information systems. We may need to hire additional accounting and financial staff with appropriate public company reporting experience and technical accounting knowledge. Other expenses associated with being a public company include increases in auditing, accounting and legal fees and expenses; investor relations expenses; increased directors’ fees and director and officer liability insurance costs; registrar and transfer agent fees and listing fees; as well as other expenses. As a public company, we are required, among other things, to:
•prepare and file periodic reports and distribute other stockholder communications, in compliance with the federal securities laws and requirements of the NYSE;
•define and expand the roles and the duties of our board of directors and its committees;
•institute more comprehensive compliance and investor relations functions; and
•evaluate and maintain our system of internal control over financial reporting, and report on management’s assessment thereof, in compliance with rules and regulations of the SEC and the Public Company Accounting Oversight Board.
We may not be successful in implementing these requirements and implementing them could materially adversely affect our business. These increased costs will decrease our net income and may require us to reduce costs in other areas of our business or increase the prices of our products or services. For example, we expect these rules and regulations to make it more difficult and more expensive for us to obtain director and officer liability insurance and we may be required to incur substantial costs to maintain the same or similar coverage. We cannot predict or estimate the amount or timing of additional costs we may incur to respond to these requirements. The impact of these requirements could also make it more difficult for us to attract and retain qualified persons to serve on our board of directors or board committees or as executive officers.
In addition, if we fail to implement the required controls with respect to our internal accounting and audit functions, our ability to report our results of operations on a timely and accurate basis could be impaired. If we do not implement the required controls in a timely manner or with adequate compliance, we may be subject to sanctions or investigation by regulatory authorities, such as the SEC or the NYSE. Any such action could harm our reputation and the confidence of investors in, and clients of, our Company and could negatively affect our business and cause the price of our shares of common stock to decline.
We are required by Section 404 of the Sarbanes‑Oxley Act to evaluate the effectiveness of our internal control over financial reporting. If we are unable to achieve and maintain effective internal controls, our operating results and financial condition could be harmed and the market price of our common stock may be negatively affected.
As a public company with SEC reporting obligations, we are required to document and test our internal control procedures to satisfy the requirements of Section 404(a) of the Sarbanes-Oxley Act, which requires annual assessments by management of the effectiveness of our internal control over financial reporting beginning with the annual report for our fiscal year ending December 31, 2025. We are an emerging growth company, and thus we are exempt from the auditor attestation requirement of Section 404(b) of Sarbanes-Oxley until such time as we no longer qualify as an emerging growth company. See “—We qualify as an emerging growth company, and any decision on our part to comply with reduced reporting and disclosure requirements applicable to emerging growth companies could make our common stock less attractive to investors.” For further discussion of these exemptions. Regardless of whether we qualify as an emerging growth company, we will still need to implement substantial internal control systems and procedures in order to satisfy the reporting requirements under the Exchange Act and applicable requirements.
We cannot assure you that there will not be material weaknesses in our internal control over financial reporting in the future. Any failure to maintain internal control over financial reporting could severely inhibit our ability to accurately report our financial condition, results of operations or cash flows. If we are unable to conclude that our internal control over financial reporting is effective, or if our independent registered public accounting firm determines that we have a material weakness in our internal control over financial reporting, investors may lose
43
confidence in the accuracy and completeness of our financial reports, the market price of our common stock could decline, and we could be subject to sanctions or investigations by the NYSE, the SEC or other regulatory authorities. Failure to remedy any material weakness in our internal control over financial reporting, or to implement or maintain other effective control systems required of public companies, could also restrict our future access to the capital markets.
We qualify as an emerging growth company, and any decision on our part to comply with reduced reporting and disclosure requirements applicable to emerging growth companies could make our common stock less attractive to investors.
We are an “emerging growth company,” and, for as long as we continue to be an emerging growth company, we currently intend to take advantage of exemptions from various reporting requirements applicable to other public companies but not to “emerging growth companies,” including, but not limited to, not being required to have our independent registered public accounting firm audit our internal control over financial reporting under Section 404 of the Sarbanes-Oxley Act, reduced disclosure obligations regarding executive compensation in our registration statements, periodic reports and proxy statements and exemptions from the requirements of holding a nonbinding advisory vote on executive compensation and stockholder approval of any golden parachute payments not previously approved. We will cease to be an emerging growth company upon the earliest of: (i) the last day of the fiscal year in which we have total annual gross revenues of $1.235 billion or more; (ii) the last day of our fiscal year following the fifth anniversary of the date of the completion of our initial public offering; (iii) the date on which we have issued more than $1.0 billion in nonconvertible debt during the previous three years; and (iv) the date on which we are deemed to be a large accelerated filer under the rules of the SEC.
We cannot predict whether investors will find our common stock less attractive if we choose to rely on these exemptions while we are an emerging growth company. If some investors find our common stock less attractive as a result of any choices to reduce future disclosure, there may be a less active trading market for our common stock and the price of our common stock may be more volatile.
Under the JOBS Act, emerging growth companies can also delay adopting new or revised accounting standards until such time as those standards apply to private companies. We have elected to avail ourselves of this extended transition period and, as a result, we will not be required to adopt new or revised accounting standards on the relevant dates on which adoption of such standards is required for other public companies.
You cannot be certain that an active trading market will continue or a specific share price will be established.
Our common stock is listed on the NYSE under the symbol “BOW.” We cannot predict whether an active and liquid trading market will continue for our common stock. If in the future an active and liquid trading market does not continue, you may have difficulty selling your shares of common stock at an attractive price, or at all. The market price for our common stock is likely to be volatile.
Our operating results and stock price may be volatile, or may decline regardless of our operating performance, and you could lose all or part of your investment.
Our quarterly operating results are likely to fluctuate in the future. In addition, securities markets worldwide have experienced, and are likely to continue to experience, significant price and volume fluctuations. This market volatility, as well as general economic, market, or political conditions, could subject the market price of our shares to wide price fluctuations regardless of our operating performance. You should consider an investment in our common stock to be risky, and you should invest in our common stock only if you can withstand a significant loss and wide fluctuation in the market value of your investment. The market price of our common stock could be subject to significant fluctuations in response to the factors described in this “Risk Factors” section and other factors, many of which are beyond our control. Among the factors that could affect our stock price are:
•market conditions in the broader stock market;
•actual or anticipated fluctuations in our quarterly financial and operating results;
44
•introduction of new products or services by us or our competitors;
•issuance of new or changed securities analysts’ reports or recommendations;
•results of operations that vary from expectations of securities analysts and investors;
•short sales, hedging and other derivative transactions in our common stock;
•guidance, if any, that we provide to the public, any changes in this guidance or our failure to meet this guidance;
•strategic actions by us or our competitors;
•announcement by us, our competitors or our acquisition targets;
•sales, or anticipated sales, of large blocks of our stock, including by our directors, executive officers and principal stockholders;
•additions or departures in our board of directors, senior management or other key personnel;
•regulatory, legal or political developments;
•public response to press releases or other public announcements by us, AmFam, or third parties, including our filings with the SEC;
•litigation and governmental investigations;
•changing economic conditions;
•changes in accounting principles;
•any indebtedness we may incur or securities we may issue in the future;
•exposure to capital and credit market risks that adversely affect our investment portfolio or our capital resources;
•changes in our credit ratings; and
•other events or factors, including those from natural disasters, war, or actors of terrorism or responses to these events.
The securities markets have from time to time experienced extreme price and volume fluctuations that often have been unrelated or disproportionate to the operating performance of particular companies. As a result of these factors, investors in our common stock may not be able to resell their shares at or above the initial offering price. These broad market fluctuations, as well as general market, economic and political conditions, such as recessions, loss of investor confidence or interest rate changes, may negatively affect the market price of our common stock.
In addition, the stock markets, including the NYSE, have experienced extreme price and volume fluctuations that have affected and continue to affect the market prices of equity securities of many companies. If any of the foregoing occurs, it could cause our stock price to fall and may expose us to securities class action litigation that, even if unsuccessful, could be costly to defend, divert management’s attention and resources, or harm our business.
Substantial future sales of shares of our common stock by existing stockholders, or the perception that those sales may occur, could cause the market price of our common stock to decline.
As of December 31, 2024, we have an aggregate of approximately 32,662,683 shares of our common stock outstanding. Of these outstanding shares, all of the shares sold in our IPO and subsequent secondary offering that closed on October 25, 2024 (the “Secondary Offering”) are freely tradable without restriction or further registration under the Securities Act, unless such shares are held by our directors, executive officers, or any of our affiliates, as
45
that term is defined in Rule 144 under the Securities Act (“Rule 144”). As of December 31, 2024, all of our remaining shares of common stock outstanding are “restricted securities” within the meaning of Rule 144. Restricted securities may not be sold in the public market unless the sale is registered under the Securities Act or an exemption from registration is available. In connection with our IPO we entered into a Registration Rights Agreement with GPC Fund, AFMIC and our Chief Executive Officer, pursuant to which GPC Fund, AFMIC and their permitted transferees may require us to register the offer and sale of all or a portion of their shares of our common stock under the Securities Act, subject to certain customary conditions and exclusions. Sales of our common stock in the public market, or the perception that these sales could occur, could cause the market price of our common stock to decline and may make it more difficult for us to sell equity or equity-linked securities in the future at a time and at a price that we deem necessary or appropriate.
In connection with each of our IPO and Secondary Offering, our executive officers and directors and certain stockholders, including GPC Fund and AMFIC each agreed to enter into “lock-up” agreements with the underwriters and thereby were subject to a lock-up periods for each offering, meaning that they and their permitted transferees were not permitted to sell any shares of our common stock during the agreed upon lock-up periods. These lock-up periods have since expired. Possible sales of our shares previously subject to those lock-ups in the market now that these agreements have expired could exert significant downward pressure on our stock price.
The Bowhead Specialty Holdings Inc. 2024 Omnibus Incentive Plan (the “2024 Plan”) permits us to issue, among other things, stock options, restricted stock units and restricted stock to eligible employees (including our named executive officers), directors and advisors, as determined by the compensation, nominating and corporate governance committee of the board of directors. We have filed a registration statement under the Securities Act to cover the issuance of shares upon the exercise of awards granted, and of shares granted, under the 2024 Plan. As a result, any shares issued under the 2024 Plan will be freely tradable in the public market. If equity securities are granted under the 2024 Plan and it is perceived that they will be sold in the public market, then the price of our common stock could decline.
Also, in the future, we may issue our securities in connection with investments or acquisitions. The amount of shares of our common stock issued in connection with an investment or acquisition could constitute a material portion of our then outstanding shares of our common stock.
Because we have no current plans to pay cash dividends on our common stock, you may not receive any return on investment unless you sell your shares of common stock for a price greater than that which you paid for it.
We have no current plans to pay cash dividends on our common stock. The declaration, amount and payment of any future dividends will be at the sole discretion of our board of directors, and will depend on, among other things, general and economic conditions, our financial condition, results of operations, capital requirements, general business conditions, legal, tax and regulatory limitations, contractual restrictions and other factors that our board of directors considers relevant. In addition, our ability to pay dividends on our capital stock is limited by the terms of the Credit Agreement and may be further restricted under the terms of any future debt or preferred securities or future credit facility. See “Dividend Policy.”
As a result, you may not receive any return on an investment in our common stock unless you sell our common stock for a price greater than your purchase price.
If securities or industry analysts do not publish research or publish inaccurate or unfavorable research about our business, our stock price and trading volume could decline.
The trading market for our common stock depends, in part, on the research and reports that securities or industry analysts publish about us or our business and our industry. If one or more of the analysts who covers us downgrades our common stock or publishes inaccurate or unfavorable research about our business, our stock price would likely decline. If one or more of these analysts ceases coverage of us or fails to publish reports on us regularly, demand for our common stock could decrease, which could cause our stock price and trading volume to decline.
46
Anti-takeover provisions in our organizational documents could delay a change in management and limit our share price.
Certain provisions of our amended and restated certificate of incorporation and amended and restated bylaws may have an anti-takeover effect and may delay, defer, or prevent a merger, acquisition, tender offer, takeover attempt, or other change of control transaction that a stockholder might consider in its best interest, including those attempts that might result in a premium over the market price for the shares held by our stockholders. These provisions will provide for, among other things:
•a classified board of directors, subject to a seven-year sunset, as a result of which our board of directors will initially be divided into three classes, with each class serving for staggered three-year terms;
•the ability of our board of directors to issue one or more series of preferred stock;
•advance notice requirements for nominations of directors by stockholders and for stockholders to include matters to be considered at our annual meetings;
•certain limitations on convening special stockholder meetings;
•the removal of directors only for cause; and
•the required approval of at least 66⅔% of the voting power of the outstanding shares of capital stock entitled to vote generally in the election of directors, voting together as a single class, to adopt, amend, or repeal certain provisions of our amended and restated certificate of incorporation.
Further, we have opted out of Section 203 of the General Corporation Law of the State of Delaware (the “DGCL”), but our amended and restated certificate of incorporation will provide that engaging in any of a broad range of business combinations with any “interested” stockholder (generally defined as any stockholder with 15.0% or more of our outstanding voting stock and any entity or person affiliated with or controlling or controlled by such stockholder) for a period of three years following the time on which the stockholder became an “interested” stockholder is prohibited, subject to certain exceptions (except with respect to GPC Fund and AmFam and any of their respective affiliates and any of their respective direct or indirect transferees of our common stock).
These anti-takeover provisions could make it more difficult for a third party to acquire us, even if the third party’s offer may be considered beneficial by many of our stockholders. These provisions also may have the effect of preventing changes in our board of directors and may make it more difficult to accomplish transactions that stockholders may otherwise deem to be in their best interests. As a result, our stockholders may be limited in their ability to obtain a premium for their shares.
Our amended and restated certificate of incorporation provides that the Court of Chancery of the State of Delaware (or if such court does not have jurisdiction, another state or the federal courts (as appropriate) located within the State of Delaware) will be the sole and exclusive forum for certain stockholder litigation matters, which could limit our stockholders’ ability to obtain a favorable judicial forum for disputes with us or our directors, officers, employees, or stockholders.
Our amended and restated certificate of incorporation provides that unless we consent to the selection of an alternative forum, the Court of Chancery of the State of Delaware (or if such court does not have jurisdiction, another state or the federal courts (as appropriate) located within the State of Delaware) shall, to the fullest extent permitted by law, be the sole and exclusive forum for any (i) derivative action or proceeding brought on behalf of the Company; (ii) action asserting a claim of breach of a fiduciary duty owed by any current or former director, officer, or other employee, or stockholder of the Company to the Company or our stockholders; (iii) action asserting a claim against the Company or any current or former director or officer of the Company arising pursuant to any provision of the DGCL, or our amended and restated certificate of incorporation or our amended and restated bylaws or as to which the DGCL confers jurisdiction on the Court of Chancery of the State of Delaware; or (iv) action asserting a claim governed by the internal affairs doctrine of the State of Delaware. Our amended and restated certificate of incorporation further provides that, unless we consent in writing to the selection of an alternative
47
forum, to the fullest extent permitted by law, the federal district courts of the United States of America will be the exclusive forum for the resolution of any complaint asserting a cause of action arising under the federal securities laws of the United States, including any claims under the Securities Act and the Exchange Act. However, Section 22 of the Securities Act creates concurrent jurisdiction for federal and state courts over all suits brought to enforce a duty or liability created by the Securities Act or the rules and regulations thereunder and, accordingly, we cannot be certain that a court would enforce such provision.
Any person or entity purchasing or otherwise acquiring any interest in shares of our capital stock shall be deemed to have notice of and consented to the forum provisions in our amended and restated certificate of incorporation, except our stockholders will not be deemed to have waived (and cannot waive) compliance with the federal securities laws and the rules and regulations thereunder. This choice of forum provision may limit a stockholder’s ability to bring a claim in a judicial forum that it finds favorable for disputes with us or any of our current or former directors, officers, other employees, or stockholders which may discourage lawsuits with respect to such claims. Alternatively, if a court were to find the choice of forum provision contained in our amended and restated certificate of incorporation to be inapplicable or unenforceable in an action, we may incur additional costs associated with resolving such action in other jurisdictions, which could harm our business, results of operations and financial condition.
We are no longer a “controlled company” within the meaning of the NYSE rules. However, we may continue to rely on exemptions from certain corporate governance requirements during a one-year transition period.
Prior to our IPO, BSHI was 100% owned by BIHL. From the IPO until October 25, 2024, BSHI was a “controlled company” within the meaning of Section 303A of the New York Stock Exchange Listed Company Manual. Following our Secondary Offering, we are no longer a “controlled company”, and will therefore be required to comply with all of the applicable corporate governance requirements of the NYSE, within the various grace periods provided by Section 303A. As a result, we were required to have at least one independent director on our Compensation, Nominating and Corporate Governance Committee upon the closing of the Secondary Offering, a majority of independent directors on our Compensation, Nominating and Corporate Governance Committee within 90 days from October 25, 2024, and a fully independent Compensation, Nominating and Corporate Governance Committee and a majority independent board of directors within one year of October 25, 2024. Accordingly, on October 30, 2024, Dr. Ava Schnidman was elected to the board of directors and further appointed to serve on our Compensation, Nominating and Corporate Governance Committee on the day of her election to the board. We will also be required to perform an annual performance evaluation of the Compensation, Nominating and Corporate Governance Committee. We are currently taking advantage of the “controlled company” exemption and do not have a fully independent Compensation, Nominating and Corporate Governance Committee or a board of directors composed of a majority of independent directors. Accordingly, during the transition period, you will not have the same protections afforded to stockholders of companies that are subject to all of the corporate governance requirements of the NYSE. Furthermore, a change in our board of directors and committee membership may result in a change in our operation philosophies and deviations from our current corporate strategy.
GPC Fund and AFMIC exercise substantial influence over us, may engage in businesses that compete with us, and your ability to influence matters requiring stockholder approval may be limited.
As of December 31, 2024, GPC Fund and AFMIC own, in the aggregate, approximately 48.0% of our outstanding common stock. So long as GPC Fund and AFMIC own a significant amount of our outstanding common stock, GPC Fund and AFMIC may exert significant voting influence over us and our corporate decisions, including any matter requiring stockholder approval regardless of whether others believe that the matter is in our best interests. For example, GPC Fund and AmFam may exert significant influence over the vote in any election of directors and any amendment of our certificate of incorporation. In addition, in connection with our IPO, we entered into the Board Nominee Agreement and the Investor Matters Agreement, which grant GPC Fund and AFMIC respectively rights to nominate individuals to our board of directors.
GPC Fund and AmFam are not restricted from, and may, engage in, invest in or operate businesses that directly compete with ours.
48
GPC Fund or AmFam may act in a manner that advances their best interests and not necessarily those of our stockholders, by, among other things:
•delaying, preventing, or deterring a change in control of us;
•entrenching our management or our board of directors; or
•influencing us to enter into transactions or agreements that are not in the best interests of all stockholders.
The concentration of ownership could deprive stockholders of an opportunity to receive a premium for their common stock as part of a sale of our company and may ultimately affect the market price of our common stock.
The track record of our executives may not be indicative of our future growth, profitability and performance.
Stephen Sills has had success starting and running publicly traded companies. However, there is no assurance that his track record will continue and that we will experience growth, profitability or results similar to any of their prior companies.
ITEM 1B. UNRESOLVED STAFF COMMENTS
None.
ITEM 1C. CYBERSECURITY
Risk Management and Strategy
The Company employs a comprehensive, cross-departmental approach designed to continuously identify, assess, and mitigate potential cybersecurity risks. Our cybersecurity risk management program involves collaboration between our employees, the Information Technology (“IT”) team, and the Information Security (“InfoSec”) team, which is led by our Chief Information Security Officer (“CISO”) . The Company’s cybersecurity policies, standards, and processes are integrated into the Company’s overall risk management program, and we regularly consider cybersecurity risks in the context of material risks to the Company.
Our cybersecurity risk management program categorizes cybersecurity risks into five distinct areas: identify, protect, detect, respond, and recover, as defined by the National Institute of Standards and Technology Cybersecurity Framework. We regularly assess the evolving cybersecurity threat landscape, employing a layered cybersecurity strategy that emphasizes prevention, detection, and mitigation through a variety of technical and operational measures. As part of our cybersecurity risk management program, our information security program is tailored to address identified risks, while aligning with pertinent business requirements.
Cybersecurity is a shared responsibility across the Company, and all our employees are subject to periodic email phishing simulation campaigns and mandatory quarterly cybersecurity training to enhance awareness and readiness against potential common cyber threats. Certain roles require additional role-based, specialized cybersecurity training, such as tabletop exercises to ensure proactive preparation and effective coordination in the event of a security incident. We conduct tabletop exercises annually or as needed to review our incident response plan, as well as to identify and prioritize opportunities for improvement within our cybersecurity program and associated security controls. To help protect our data and information systems, we maintain Company-wide cybersecurity policies and procedures regarding encryption standards, antivirus protection, remote access, multifactor authentication, confidential information, and internet, social media, email, and wireless device usage. Our IT and InfoSec teams review and update such policies and procedures to adapt to the evolving cybersecurity threat landscape, industry best practices, and regulatory updates. Our CISO conducts thorough reviews of these updates on an annual basis or as needed to help ensure their continued relevance and effectiveness in safeguarding the Company’s assets and business interests.
49
We continually seek to update our cybersecurity posture, encompassing end-user awareness training, layered defenses, critical asset identification and protection, enhanced monitoring and alerting. We engage with third-party experts to evaluate the efficacy of our security measures which includes network penetration testing. We also regularly evaluate cybersecurity risks associated with our use of third-party service providers, conducting an annual review of hosted applications and assessing their cybersecurity readiness. In addition, we annually obtain Service Organization Control (“SOC”) reports on the suitability and operating effectiveness of the service providers’ controls, known as a SOC 1 Type 2 Report. The report is prepared by an independent service auditor. We review such reports to confirm the existence of effective security controls over unauthorized access at third party service providers.
Governance
ITEM 2. PROPERTIES
Although our business is run largely remotely, we lease offices located in New York, New York, and Chicago, Illinois. We do not own any real property. We believe that our existing facilities are sufficient for our current needs.
ITEM 3. LEGAL PROCEEDINGS
We are subject to routine legal proceedings in the normal course of operating our insurance business. We are not currently a party to any such claims, lawsuits or proceedings, the outcome of which, if determined adversely to us, we believe would, individually or in the aggregate, have a material adverse effect on our business, results of operations or financial condition.
ITEM 4. MINE SAFETY DISCLOSURES
Not applicable.
PART II
ITEM 5. MARKET FOR REGISTRANT'S COMMON EQUITY, RELATED STOCKHOLDER MATTERS AND ISSUER PURCHASES OF EQUITY SECURITIES
Market Information and Holders of our Common Stock
On May 23, 2024, our common stock began trading on the NYSE under the symbol “BOW”. Prior to that time, there was no public market for our common stock.
50
As of February 25, 2025, there were approximately 62 holders of record of our common stock. Because most of our shares of common stock are held by brokers and other institutions on behalf of our stockholders, this number is not representative of our total stockholders.
Dividends
Any determination to pay dividends in the future will be at the discretion of our Board of Directors and will depend upon results of operations, financial condition, restrictions imposed by applicable law and other factors our Board of Directors deems relevant.
Since the growth and continued operation of our business will require capital, we do not intend to declare and pay cash dividends on shares of our common stock in the foreseeable future.
As a holding company, substantially all of our operations are conducted through our wholly-owned insurance and service company subsidiaries. Our ability to pay dividends to stockholders is largely dependent on dividends and other distributions from BICI and our other operating companies. State insurance regulators require insurance companies to maintain specified levels of statutory capital and surplus and restrict dividend payments. BICI’s ability to pay dividends is restricted under the insurance laws and regulations of the Wisconsin OCI.
Stock Performance Graph
The following performance graph compares the cumulative total stockholder return of an investment in (1) our common stock, (2) the cumulative total returns to the Russell 2000 Index and (3) the cumulative total returns to the Standard & Poor's Composite 1500 Property & Casualty Insurance Index for the period from May 23, 2024 (the date our common stock began trading on the NYSE) through December 31, 2024.
The graph assumes an initial investment of $100. Such returns are based on historical results and are not indicative of future performance.
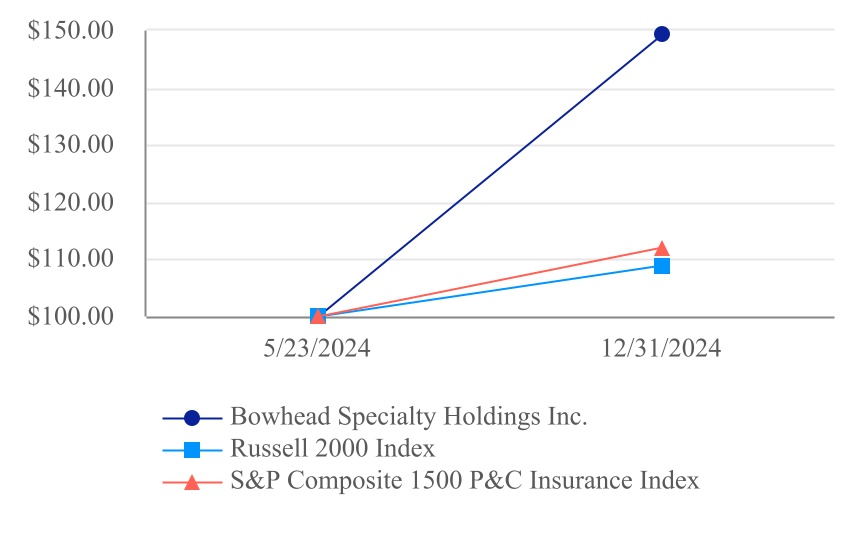
| May 23, 2024 | December 31, 2024 | |||||||||||||
| Bowhead Specialty Holdings Inc. | $ | 100.00 | $ | 149.24 | ||||||||||
| Russell 2000 Index | $ | 100.00 | $ | 108.87 | ||||||||||
| S&P Composite 1500 P&C Insurance Index | $ | 100.00 | $ | 111.98 | ||||||||||
51
Issuer Repurchase of Equity Securities
The table below provides information regarding the number of common stock repurchased in the quarter ended December 31, 2024:
| Period |
Total number of shares purchased (1)
|
Average price paid per share | Total number of shares purchased as part of publicly announced programs | Maximum number (or approximate dollar value) of shares that may yet be purchased under the program | ||||||||||||||||||||||
| October 1-31, 2024 | 140 | $ | 28.23 | — | — | |||||||||||||||||||||
| November 1-30, 2024 | — | $ | — | — | — | |||||||||||||||||||||
| December 1-31, 2024 | — | $ | — | — | — | |||||||||||||||||||||
| Total | 140 | — | ||||||||||||||||||||||||
__________________
(1) Represents shares repurchased from employees to satisfy personal withholding tax liabilities that arise on the vesting of restricted stock units.
ITEM 6. [RESERVED]
52
ITEM 7. MANAGEMENT’S DISCUSSION AND ANALYSIS OF FINANCIAL CONDITION AND RESULTS OF OPERATIONS
Year ended December 31, 2023 compared to year ended December 31, 2022
For a discussion of our year ended December 31, 2023 results and a comparison between the years ended December 31, 2023 and 2022, see “Management’s Discussion and Analysis of Financial Condition and Results of Operations” in our Form S-1 Registration Statement, filed with the SEC on October 21, 2024.
Overview
We were founded in September 2020, backed by capital provided by GPC Fund, a private equity fund managed by Gallatin Point, and our strategic partner, AmFam, to take advantage of favorable pricing environments, and to address a growing and unmet demand from brokers and policyholders for specialized insurance solutions and quality service in complex lines of business. Our principal objective is to create and sustain superior returns for our stockholders by generating consistent, underwriting profits across our product offerings and through all market cycles, while prudently managing capital.
We offer commercial specialty P&C insurance products to policyholders that vary in size, industry and complexity, focusing on casualty, professional liability, and healthcare liability risks. We provide “craft” underwriting solutions, which require deep underwriting and claims expertise in order to produce attractive financial results. In May 2024, we supplemented our “craft” solution with our “flow” underwriting operation, which is a streamlined, tech-enabled low touch form of underwriting, focused on small, niche and hard-to-place risks. Our policies are primarily written on a non-admitted, or E&S basis, which is free of rate and policy form restrictions, and provides the flexibility to rapidly adjust to emerging market opportunities. We distribute our products through carefully selected relationships with leading distribution partners in both the wholesale and retail markets.
The policies we write are issued on AmFam paper under their own name through BSUI, our managing general agency, in exchange for a Ceding Fee, and reinsured 100% to BICI, our wholly-owned insurance company subsidiary. This mutually beneficial partnership with AmFam has enabled us to grow quickly, but prudently, to take advantage of favorable market conditions, and allows us to deploy capital efficiently.
We built a nimble, remote-friendly organization that is able to attract best-in-class talent nationwide, who are committed to operational excellence and superior service. We are led by a highly experienced and respected underwriting team with a disciplined approach to underwriting and decades of individual, successful underwriting experience. We are supported by a collaborative culture that spans all functions of our business, which allows us to provide a consistent, positive experience for all our partners. We believe that our current market opportunity, differentiated expertise, relationships, culture and leadership team position us well to continue to grow our business profitably.
Components of Our Results of Operations
Gross written premiums
Gross written premiums are the amounts received, or to be received, for insurance policies written or assumed by us during a specific period of time without reduction for policy acquisition costs, reinsurance costs or other deductions. The volume of our gross written premiums in any given period is generally influenced by new business submissions, binding of new business submissions into policies, renewals of existing policies and average size and premium rate of bound policies.
Ceded written premiums
Ceded written premiums are the amount of gross written premiums ceded to reinsurers. We enter into reinsurance contracts to limit our exposure to potential losses. The volume of our ceded written premiums is impacted by the level of our gross written premiums and any decision we make to increase or decrease retention levels and policy limits.
53
Net written premiums
Net written premiums are gross written premiums less ceded written premiums.
Net earned premiums
Net earned premiums represent the earned portion of our net written premiums. Our insurance policies generally have a term of one year but occasionally could be as long as seven years, and premiums are earned pro rata over the term of the policy.
Net losses and loss adjustment expenses
Net losses and loss adjustment expenses represent the costs incurred for insured losses, which include losses under a claims made or occurrence policy, paid or unpaid, expenses for settling claims, such as attorneys’ fees, investigation, appraisal, adjustment, defense costs and a portion of operating expenses allocated to claim resolution, net of any losses ceded to reinsurers. Net losses and loss adjustment expenses also include a provision for claims that have occurred but have not yet been reported to the insurer. These expenses are a function of the amount and type of insurance contracts the Company writes and the loss experience associated with the underlying coverage. In general, our net losses and loss adjustment expenses are affected by:
•the occurrence, frequency and severity of claims associated with the particular types of insurance contracts that we write;
•the mix of business written by us;
•changes in the legal or regulatory environment related to the business we write;
•trends in legal defense costs;
•inflation in the cost of claims, including inflation related to wages, medical costs, and building materials, as well as inflation related to the increase in the severity of claims above general economic inflation (i.e., social inflation); and
•the reinsurance agreements we have in place at the time of a loss.
Net losses and loss adjustment expenses are based on actual losses and expenses, as well as an actuarial analysis of the estimated losses, including losses incurred during the period and changes in estimates from prior periods. Net losses and loss adjustment expenses may be paid out over a period of years.
Net acquisition costs
Net acquisition costs are principally comprised of commissions we pay to our brokers, a ceding fee we pay to AmFam on net premiums assumed and premium-related taxes, which are net of ceding commissions we receive on business ceded through our reinsurance agreements. Net acquisition costs are deferred and amortized ratably over the terms of the related agreements.
Operating expenses
Operating expenses represent the general and administrative expenses of our operations including employee compensation and benefits, technology costs, office rent and professional service fees such as legal, accounting and actuarial services.
Net investment income
We earn interest income on our portfolio of invested assets, which are comprised of fixed maturity securities, short-term investments and cash and cash equivalents.
54
Net realized investment losses
Net realized investment losses are a function of the difference between the amortized cost of securities sold and the proceeds received by the Company upon the sale of a security. Unrealized investment gains (losses) on fixed maturity securities are recorded within accumulated other comprehensive loss on the Consolidated Balance Sheets.
Other insurance-related income
Other insurance-related income represent fees associated with the issuance of policies and revenue we receive for providing insurance-related services.
Non-operating expenses
Non-operating expenses represent expenses related to various transactions that we consider to be unique and non-recurring in nature, including expenses related to our IPO and Secondary Offering.
Warrant expense
Warrant expense represents compensation cost for warrants issued to AmFam for the right to purchase shares of the Company’s common stock.
Credit facility interest expenses and fees
Credit facility interest expenses and fees represent certain costs associated with the Credit Agreement (as defined below), which provides for a senior secured revolving credit facility.
Foreign exchange losses (gains)
Foreign exchange losses (gains) represent the remeasurement of a non-U.S. dollar operating expense to U.S. dollars due to the fluctuations in the exchange rate. The change in the liability due to the fluctuations in the exchange rate are included within the Consolidated Statements of Income and Comprehensive Income (Loss) at the end of each period.
Income tax expense
Currently, income tax expense primarily relates to federal income taxes. The amount of income tax expense or benefit recorded in future periods will depend on the jurisdictions in which we operate and the tax laws and regulations in effect.
Key Operating and Financial Metrics
We discuss certain key metrics, described below, which provide useful information about our business and the operational factors underlying our financial performance.
Loss ratio, expressed as a percentage, is the ratio of net losses and loss adjustment expenses to net earned premiums.
Expense ratio, expressed as a percentage, is the ratio of net acquisition costs and operating expenses, less other- insurance related income, to net earned premiums.
Combined ratio, expressed as a percentage, is the sum of loss ratio and expense ratio.
Return on equity is net income as a percentage of average beginning and ending mezzanine equity and stockholders’ equity.
Underwriting income is a non-GAAP financial measure defined as income before income taxes excluding the impact of net investment income, net realized investment losses, other insurance-related income, non-operating expenses, warrant expense, credit facility interest expenses and fees, foreign exchange losses (gains), and certain strategic initiatives. See “—Reconciliation of Non-GAAP Financial Measures” for a reconciliation of underwriting
55
income to income before income taxes, which is the most directly comparable financial metric prepared in accordance with U.S. GAAP.
Adjusted net income is a non-GAAP financial measure defined as net income excluding the impact of net realized investment losses, non-operating expenses, foreign exchange losses (gains), and certain strategic initiatives. See “—Reconciliation of Non-GAAP Financial Measures” for a reconciliation of adjusted net income to net income, which is the most directly comparable financial metric prepared in accordance with U.S. GAAP.
Adjusted return on equity is a non-GAAP financial measure defined as adjusted net income as a percentage of average beginning and ending mezzanine equity and stockholders’ equity. See “—Reconciliation of Non-GAAP Financial Measures” for a reconciliation of adjusted return on equity to return on equity, which is the most directly comparable financial metric prepared in accordance with U.S. GAAP.
Diluted adjusted earnings per share is a non-GAAP financial measure defined as adjusted net income divided by the weighted average common shares outstanding for the period, reflecting the dilution that may occur if equity based awards are converted into common stock equivalents as calculated using the treasury stock method. See “—Reconciliation of Non-GAAP Financial Measures” for a reconciliation of diluted adjusted earnings per share to diluted earnings per share, which is the most directly comparable financial metric prepared in accordance with U.S.
56
Results of Operations
Year ended December 31, 2024 compared to year ended December 31, 2023
The following table summarizes our results of operations for the years ended December 31, 2024 and 2023:
| Years Ended December 31, | |||||||||||||||||||||||
| 2024 | 2023 | $ Change | % Change | ||||||||||||||||||||
| ($ in thousands, except percentages and per share data) | |||||||||||||||||||||||
| Gross written premiums | $ | 695,717 | $ | 507,688 | $ | 188,029 | 37.0 | % | |||||||||||||||
| Ceded written premiums | (244,295) | (173,016) | (71,279) | 41.2 | % | ||||||||||||||||||
| Net written premiums | $ | 451,422 | $ | 334,672 | $ | 116,750 | 34.9 | % | |||||||||||||||
| Revenues | |||||||||||||||||||||||
| Net earned premiums | $ | 385,111 | $ | 263,902 | $ | 121,209 | 45.9 | % | |||||||||||||||
| Net investment income | 40,121 | 19,371 | 20,750 | 107.1 | % | ||||||||||||||||||
| Net realized investment losses | (16) | — | (16) | NM | |||||||||||||||||||
| Other insurance-related income | 444 | 125 | 319 | 255.2 | % | ||||||||||||||||||
| Total revenues | 425,660 | 283,398 | 142,262 | 50.2 | % | ||||||||||||||||||
| Expenses | |||||||||||||||||||||||
Net losses and loss adjustment expenses |
248,099 | 166,282 | 81,817 | 49.2 | % | ||||||||||||||||||
| Net acquisition costs | 32,397 | 20,935 | 11,462 | 54.8 | % | ||||||||||||||||||
| Operating expenses | 89,112 | 63,456 | 25,656 | 40.4 | % | ||||||||||||||||||
| Non-operating expenses | 2,807 | 630 | 2,177 | 345.6 | % | ||||||||||||||||||
| Warrant expense | 1,917 | — | 1,917 | NM | |||||||||||||||||||
| Credit facility interest expenses and fees | 725 | — | 725 | NM | |||||||||||||||||||
| Foreign exchange losses (gains) | 68 | (20) | 88 | (440.0) | % | ||||||||||||||||||
Total expenses |
375,125 | 251,283 | 123,842 | 49.3 | % | ||||||||||||||||||
| Income before income taxes | 50,535 | 32,115 | 18,420 | 57.4 | % | ||||||||||||||||||
Income tax expense |
(12,292) | (7,068) | (5,224) | 73.9 | % | ||||||||||||||||||
Net income |
$ | 38,243 | $ | 25,047 | $ | 13,196 | 52.7 | % | |||||||||||||||
| Key Operating and Financial Metrics: | |||||||||||||||||||||||
Underwriting income(1)
|
$ | 18,236 | $ | 14,035 | $ | 4,201 | 29.9 | % | |||||||||||||||
Adjusted net income(1)
|
42,686 | 26,152 | 16,534 | 63.2 | % | ||||||||||||||||||
| Loss ratio | 64.4 | % | 63.0 | % | |||||||||||||||||||
| Expense ratio | 31.4 | % | 31.9 | % | |||||||||||||||||||
| Combined ratio | 95.8 | % | 94.9 | % | |||||||||||||||||||
Return on equity |
13.6 | % | 18.2 | % | |||||||||||||||||||
Adjusted return on equity(1)
|
15.2 | % | 19.0 | % | |||||||||||||||||||
| Diluted earnings per share | $ | 1.29 | $ | 1.04 | |||||||||||||||||||
Diluted adjusted earnings per share(1)
|
$ | 1.44 | $ | 1.09 | |||||||||||||||||||
__________________
NM - Percentage change is not meaningful.
(1) Non-GAAP financial measure. See “—Reconciliation of Non-GAAP Financial Measures” for a reconciliation of the non-GAAP financial measure in accordance with the most comparable U.S. GAAP measure.
57
Premiums
The following table presents gross written premiums by underwriting division for the years ended December 31, 2024 and 2023:
| Years Ended December 31, | |||||||||||||||||||||||||||||||||||
| 2024 | % of Total | 2023 | % of Total | $ Change | % Change | ||||||||||||||||||||||||||||||
| ($ in thousands, except percentages) | |||||||||||||||||||||||||||||||||||
| Casualty | $ | 431,817 | 62.1 | % | $ | 277,455 | 54.7 | % | $ | 154,362 | 55.6 | % | |||||||||||||||||||||||
| Professional Liability | 160,651 | 23.1 | % | 145,251 | 28.6 | % | 15,400 | 10.6 | % | ||||||||||||||||||||||||||
| Healthcare Liability | 101,619 | 14.6 | % | 84,982 | 16.7 | % | 16,637 | 19.6 | % | ||||||||||||||||||||||||||
| Baleen Specialty | 1,630 | 0.2 | % | — | — | % | 1,630 | NM | |||||||||||||||||||||||||||
Gross written premiums
|
$ | 695,717 | 100.0 | % | $ | 507,688 | 100.0 | % | $ | 188,029 | 37.0 | % | |||||||||||||||||||||||
Gross written premiums increased $188.0 million, or 37.0%, to $695.7 million for the year ended December 31, 2024 from $507.7 million for year ended December 31, 2023. The increase was driven by renewals, new business and continued growth in our platform across all four divisions. For the years ended December 31, 2024 and 2023, E&S business made up 75.8% and 79.2% of gross written premiums, respectively, while admitted business made up 24.2% and 20.8%, respectively. The 3.4 point decrease in the proportion of E&S business written was driven by the Casualty division, where an admitted product was required on specialty business written.
Net written premiums increased $116.7 million, or 34.9%, to $451.4 million for the year ended December 31, 2024 from $334.7 million for the year ended December 31, 2023. The increase was primarily due to the growth in gross written premiums for the year ended December 31, 2024, partially offset by the increase in ceded written premium primarily due to the volume of written premiums subject to the ceded quota share reinsurance treaties within our Casualty underwriting division and the Cyber line of business within our Professional Liability division.
Net earned premiums increased $121.2 million, or 45.9%, to $385.1 million for the year ended December 31, 2024 from $263.9 million for the year ended December 31, 2023. The increase was primarily due to the earning of increased gross written premiums offset by the earning of increased ceded written premiums under our ceded reinsurance treaties.
Loss ratio
The following table summarizes the components of our loss ratio for the years ended December 31, 2024 and 2023:
| Years Ended December 31, | |||||||||||||||||||||||
| 2024 | 2023 | ||||||||||||||||||||||
| Net Losses and Loss Adjustment Expenses | % of Net Earned Premiums | Net Losses and Loss Adjustment Expenses | % of Net Earned Premiums | ||||||||||||||||||||
| ($ in thousands, except percentages) | |||||||||||||||||||||||
| Current accident year | $ | 248,099 | 64.4 | % | $ | 166,282 | 63.0 | % | |||||||||||||||
| Prior accident year reserve development | — | — | % | — | — | % | |||||||||||||||||
Total
|
$ | 248,099 | 64.4 | % | $ | 166,282 | 63.0 | % | |||||||||||||||
Our loss ratio was 64.4% for the year ended December 31, 2024 compared to 63.0% for the year end December 31, 2023, or an increase of 1.4 points. The increase was due to the mix changes in our portfolio, where Casualty, which has higher current accident year industry loss ratios, comprised a larger proportion of the Company’s gross written premiums—62.1% in 2024 compared to 54.7% in 2023. There was no prior accident year reserve development in our loss ratio for the year.
58
In the fourth quarter of 2024, as part of our annual independent actuarial reserve review, we reallocated prior accident year loss reserves by division, primarily from Professional Liability to Casualty, to align more closely with industry loss ratios. The increase in our loss ratio and reallocation of prior accident year loss reserves are primarily based on inputs from industry data due to Bowhead’s limited loss experience. See Note 6, “Reserves for Losses and Loss Adjustment Expenses” in our Notes to the Consolidated Financial Statements included in this Annual Report on Form 10-K.
Expense ratio
The following table summarizes the components of our expense ratio for the years ended December 31, 2024 and 2023:
| Years Ended December 31, | |||||||||||||||||||||||
| 2024 | 2023 | ||||||||||||||||||||||
| Expenses | % of Net Earned Premiums | Expenses | % of Net Earned Premiums | ||||||||||||||||||||
| ($ in thousands, except percentages) | |||||||||||||||||||||||
Net acquisition costs |
$ | 32,397 | 8.4 | % | $ | 20,935 | 7.9 | % | |||||||||||||||
Operating expenses |
89,112 | 23.1 | % | 63,456 | 24.0 | % | |||||||||||||||||
| Less: Other insurance-related income | (444) | (0.1) | % | (125) | — | % | |||||||||||||||||
Total expense ratio
|
$ | 121,065 | 31.4 | % | $ | 84,266 | 31.9 | % | |||||||||||||||
Our expense ratio was 31.4% for the year ended December 31, 2024 compared to 31.9% for the year ended December 31, 2023, a decrease of 0.5 points. The decrease was driven by the 0.9 point decrease in our operating expenses ratio, which was partially offset by the 0.5 point increase in net acquisition costs ratio. The decrease in our operating expenses ratio was due to the continued scaling of our business, where net earned premiums grew at a higher rate than our expenses, as well as the prudent management of our expenses. The increase in our net acquisition costs ratio was driven by the increase in broker commissions due to mix changes in our portfolio, where Casualty, which has higher broker commissions, comprised a larger proportion of the Company’s gross written premiums, and the reduction in ceding commission rates in our 2024 ceded reinsurance treaties. Gross acquisition costs as a percentage of gross earned premiums was 15.7% for the year ended December 31, 2024 compared to 15.0% for the year ended December 31, 2023, and ceded earned commissions as a percentage of ceded earned premium was 29.0% for the year ended December 31, 2024 compared to 29.4% for the year ended December 31, 2023.
Combined ratio
The combined ratio was 95.8% for the year ended December 31, 2024, compared to 94.9% for the year ended December 31, 2023. The 0.9 point increase was due to the 1.4 point increase in the loss ratio, partially offset by the 0.5 point decrease in the expense ratio.
59
Return on equity
Return on equity was 13.6% for the year ended December 31, 2024, compared to 18.2% for the year ended December 31, 2023. The 4.6 point decrease was primarily driven by the $178.4 million increase in mezzanine equity and stockholders’ equity, mainly due to the $131.0 million of net proceeds received from the IPO and $38.2 million of net income generated during the year, and a $7.3 million reduction in after tax net income as a result of the costs related to the IPO and Secondary Offering. Costs incurred as a result of the IPO and Secondary Offering included non-deferrable and non-recurring costs directly attributable to the IPO and Secondary Offering, which are disclosed as non-operating expenses within the Consolidated Statements of Income and Comprehensive Income (Loss), and additional expenses that were incurred as a result of IPO, which included the acceleration of remaining stock-based compensation costs associated with the Class P interests, expenses associated with the issuances of RSUs, PSUs and warrants, and deferred financing costs associated with the establishment of our Facility.
Investing results
Net investment income increased $20.8 million, or 107.1%, to $40.1 million for the year ended December 31, 2024 from $19.4 million for the year ended December 31, 2023. The increase was due to the growth in our investment portfolio, stemming from net cash provided by operating activities and net proceeds we received from the IPO, and higher yields on invested assets.
Income tax expense
Income tax expense was $12.3 million for the year ended December 31, 2024, compared to $7.1 million for the year ended December 31, 2023. Our effective tax rate was 24.3% for the year ended December 31, 2024, compared to 22.0% for the year ended December 31, 2023. The effective tax rate may vary slightly from the statutory tax rate due to state taxes and certain tax adjustments for permanent differences.
Reconciliation of Non-GAAP Financial Measures
Underwriting income
We define underwriting income as income before income taxes excluding the impact of net investment income, net realized investment losses, other insurance-related income, non-operating expenses, warrant expense, credit facility interest expenses and fees, foreign exchange losses (gains), and certain strategic initiatives. Underwriting income represents the pre-tax profitability of the Company's underwriting operations and allows us to evaluate our underwriting performance without regard to net investment income. We use this metric as we believe it gives our management and other users of our financial information useful insight into our underlying business performance. Underwriting income should not be viewed as a substitute for income before income taxes calculated in accordance with U.S. GAAP, and other companies may define underwriting income differently.
60
Underwriting income for the years ended December 31, 2024 and 2023 reconciles to income before income taxes as follows:
| Years Ended December 31, | |||||||||||
| 2024 | 2023 | ||||||||||
| ($ in thousands) | |||||||||||
| Income before income taxes | $ | 50,535 | $ | 32,115 | |||||||
| Adjustments: | |||||||||||
| Net investment income | (40,121) | (19,371) | |||||||||
| Net realized investment losses | 16 | — | |||||||||
| Other insurance-related income | (444) | (125) | |||||||||
| Non-operating expenses | 2,807 | 630 | |||||||||
| Warrant expense | 1,917 | — | |||||||||
| Credit facility interest expenses and fees | 725 | — | |||||||||
| Foreign exchange losses (gains) | 68 | (20) | |||||||||
Strategic initiatives(1)
|
2,733 | 806 | |||||||||
| Underwriting income | $ | 18,236 | $ | 14,035 | |||||||
__________________
(1)Strategic initiatives for the years ended December 31, 2024 and 2023 represent costs incurred to set up our Baleen Specialty division, which is recorded in operating expenses within the Consolidated Statements of Income and Comprehensive Income (Loss). The costs incurred primarily represent expenses to implement the new platform and processes supporting the Baleen Specialty division.
Adjusted net income
We define adjusted net income as net income excluding the impact of net realized investment losses, non-operating expenses, foreign exchange losses (gains), and certain strategic initiatives. Adjusted net income excludes the impact of certain items that may not be indicative of underlying business trends, operating results, or future outlook, net of tax impact. We calculate the tax impact only on adjustments that would be included in calculating our income tax expense using the estimated tax rate at which we received a deduction for these adjustments. We use adjusted net income as an internal performance measure in the management of our operations because we believe it gives our management and other users of our financial information useful insight into our results of operations and our underlying business performance. Adjusted net income should not be viewed as a substitute for net income calculated in accordance with U.S. GAAP, and other companies may define adjusted net income differently.
61
Adjusted net income for the years ended December 31, 2024 and 2023 reconciles to net income as follows:
| Years Ended December 31, | |||||||||||||||||||||||
| 2024 | 2023 | ||||||||||||||||||||||
| Before income taxes | After income taxes | Before income taxes | After income taxes | ||||||||||||||||||||
| ($ in thousands) | |||||||||||||||||||||||
| Income as reported | $ | 50,535 | $ | 38,243 | $ | 32,115 | $ | 25,047 | |||||||||||||||
| Adjustments: | |||||||||||||||||||||||
| Net realized investment losses | 16 | 16 | — | — | |||||||||||||||||||
| Non-operating expenses | 2,807 | 2,807 | 630 | 630 | |||||||||||||||||||
| Foreign exchange losses (gains) | 68 | 68 | (20) | (20) | |||||||||||||||||||
Strategic initiatives(1)
|
2,733 | 2,733 | 806 | 806 | |||||||||||||||||||
| Tax impact | — | (1,181) | — | (311) | |||||||||||||||||||
| Adjusted net income | $ | 56,159 | $ | 42,686 | $ | 33,531 | $ | 26,152 | |||||||||||||||
_________________
(1)Strategic initiatives for the years ended December 31, 2024 and 2023 represent costs incurred to set up our Baleen Specialty division, which is recorded in operating expenses within the Consolidated Statements of Income and Comprehensive Income (Loss). The costs incurred primarily represent expenses to implement the new platform and processes supporting the Baleen Specialty division.
Adjusted return on equity
We define adjusted return on equity as adjusted net income as a percentage of average beginning and ending mezzanine equity and stockholders’ equity. We use adjusted return on equity as an internal performance measure in the management of our operations because we believe it gives our management and other users of our financial information useful insight into our results of operations and our underlying business performance. Adjusted return on equity should not be viewed as a substitute for return on equity calculated in accordance with U.S. GAAP, and other companies may define adjusted return on equity differently.
Adjusted return on equity for the years ended December 31, 2024 and 2023 reconciles to return on equity as follows:
| Year Ended December 31, | |||||||||||
| 2024 | 2023 | ||||||||||
($ in thousands, except percentages) |
|||||||||||
Numerator: Adjusted net income(1)
|
$ | 42,686 | $ | 26,152 | |||||||
Denominator: Average mezzanine equity and stockholders' equity |
281,259 | 137,726 | |||||||||
| Adjusted return on equity | 15.2 | % | 19.0 | % | |||||||
Diluted adjusted earnings per share
We define diluted adjusted earnings per share adjusted net income divided by the weighted average common shares outstanding for the period, reflecting the dilution that may occur if equity based awards are converted into common stock equivalents as calculated using the treasury stock method. We use diluted adjusted earnings per share as an internal performance measure in the management of our operations because we believe it gives our management and other users of our financial information useful insight into our results of operations and our underlying business performance. Diluted adjusted earnings per share should not be viewed as a substitute for diluted earnings per share calculated in accordance with U.S. GAAP, and other companies may define diluted adjusted earnings per shares differently
62
Diluted adjusted earnings per share for the years ended December 31, 2024 and 2023 reconciles to diluted earnings per share as follows:
| Year Ended December 31, | |||||||||||
| 2024 | 2023 | ||||||||||
| ($ in thousands, except share and per share data) | |||||||||||
| Numerator: Adjusted net income | $ | 42,686 | $ | 26,152 | |||||||
Denominator: Diluted weighted average shares outstanding |
29,677,196 | 24,000,000 | |||||||||
Diluted adjusted earnings per share
|
$ | 1.44 | $ | 1.09 | |||||||
Liquidity and Capital Resources
Sources and Uses of Funds
BSHI is organized as a Delaware holding company with our operations primarily conducted by our wholly- owned insurance company subsidiary, BICI, domiciled in the State of Wisconsin, BSUI, our wholly-owned managing general agency, and Bowhead Underwriting Services, Inc. (“BUSI”), our wholly-owned services company subsidiary.
Prior to the IPO, BSHI received capital contributions from BIHL. Following our Secondary Offering on October 25, 2024, since BIHL is no longer a holder of our common stock, BSHI may receive cash through (i) drawing on the Facility (as defined below) that we entered into on April 22, 2024, (ii) issuance of equity and debt securities, (iii) payments from our subsidiaries pursuant to our consolidated tax allocation agreement and other transactions and (iv) dividends from our insurance company subsidiary. We also may use the proceeds from these sources to contribute funds to our insurance company subsidiary in order to support premium growth, pay dividends and taxes and for other business purposes.
We file a consolidated U.S. federal income tax return with our subsidiaries, and under our tax allocation agreement, each participant is charged or refunded taxes according to the amount that the participant would have paid or received had it filed on a separate return basis with the Internal Revenue Service.
Our insurance company subsidiary, BICI, is licensed and domiciled in the State of Wisconsin. Under Wisconsin law, BICI is required to maintain specified levels of statutory capital and surplus and is restricted by law as to the amount of dividends it can pay without the approval of regulatory authorities. BICI is restricted from paying dividends by the lesser of: (i) 10% of statutory capital and surplus as of the preceding December 31, or; (ii) the greater of: (A) statutory net income for the calendar year preceding the date of the dividend distribution, minus realized capital gains for that year, or (B) aggregate of net income for the three months preceding the date of the dividend or distribution, minus realized capital gains for those calendar years and minus dividends paid or credited and distributions made within the first two of the preceding three calendar years. As of December 31, 2024, the maximum dividend that BICI could pay without the approval of regulatory authorities was $16.1 million. Insurance regulators have broad powers to prevent the reduction of statutory surplus to inadequate levels, and there is no assurance that dividends of the maximum amounts calculated under any applicable formula would be permitted. State insurance regulatory authorities that have jurisdiction over the payment of dividends by our insurance company subsidiary may in the future adopt statutory provisions more restrictive than those currently in effect.
As of December 31, 2024, our holding company had $21.0 million in cash and investments. We believe we have sufficient liquidity available at our holding company and subsidiaries to meet our operating cash needs and obligations for at least the next 12 months.
63
Revolving Credit Facility
On April 22, 2024, the Company entered into a Credit Agreement with certain lenders and JPMorgan Chase Bank, N.A., as administrative agent, swingline lender and issuing bank. The Credit Agreement provides for a Facility in the aggregate principal amount of $75 million, which includes a $5 million sub-facility for letters of credit. All obligations under the Facility and obligations in respect of certain cash management services and swap agreements with the lenders and their affiliates are (i) unconditionally guaranteed by certain of the Company’s subsidiaries and (ii) secured by a first-priority perfected lien in substantially all of the Company’s and the subsidiaries guarantors’ assets. The Credit Agreement contains certain customary covenants, including financial maintenance covenants. The Company was in compliance with all of the Facility’s covenants as of December 31, 2024. The Facility matures on the earlier of April 22, 2027, or 91 days prior to the MGA Agreement termination date where no MGA Agreement replacement is found. The Company may request that the lenders extend the maturity date by an additional year, provided that the request is made no earlier than 90 days and no later than 55 days prior to the first or second anniversary of the effective date of the Facility.
As of December 31, 2024, we did not have any borrowings outstanding under the Facility.
Cash Flows
Our most significant source of cash is from premiums received, which, for most policies, we receive at the beginning of the coverage period, net of the related commission for the policies. Our most significant cash outflows include claims that arise when a policyholder incurs an insured loss. Because the payment of claims occurs after the receipt of the premium, often years later, we invest the cash in various investment securities that generally earn interest. We also use cash to pay ceded reinsurance premiums, net of ceding commissions received, and for payment of ongoing operating expenses, such as employee compensation and benefits, technology costs, office rent and professional service fees.
The timing of our cash flows from operating activities can vary among periods due to the timing by which payments are made or received. Some of our payments and receipts, including loss settlements and subsequent reinsurance receipts, can be significant, and as a result their timing can influence cash flows from operating activities in any given period. We believe that cash receipts from premiums and proceeds from net investment income are sufficient to cover cash outflows in the foreseeable future.
Our cash flows for the years ended December 31, 2024 and 2023 were as follows:
| Years Ended December 31, | |||||||||||
| 2024 | 2023 | ||||||||||
| ($ in thousands) | |||||||||||
| Net cash provided by operating activities | $ | 294,287 | $ | 236,225 | |||||||
| Net cash used in investing activities | (325,883) | (274,765) | |||||||||
| Net cash provided by (used in) financing activities | 133,886 | 77,656 | |||||||||
Net change in cash, cash equivalents and restricted cash
|
$ | 102,290 | $ | 39,117 | |||||||
The increase in cash provided by operating activities in the year ended December 31, 2024 compared to the year ended December 31, 2023 was primarily due to the growth in our business operations compared to the timing of claim payments and subsequent reinsurance recoveries, which occur later than cash collections on premiums.
For the year ended December 31, 2024, net cash used in investing activities of $325.9 million was due to the growth in our business operations. For the year ended December 31, 2024, funds from operations and net proceeds from the IPO, together with proceeds received from the sale and maturity on fixed maturity securities of $281.2 million and short-term investments of $9.0 million, were used to purchase fixed maturity securities of $603.0 million and short-term investments of $9.9 million. Net cash used in investing activities also includes purchases of property and equipment of $3.1 million.
64
For the year ended December 31, 2023, net cash used in investing activities was $274.8 million. For the year ended December 31, 2023, funds from operations, together with proceeds received from the sale and maturity on fixed maturity securities of $36.8 million and short-term investments of $59.5 million, were used to purchase fixed maturity securities of $345.8 million and short-term investments of $21.4 million. Net cash used in investing activities also includes purchases of property and equipment of $3.8 million.
For the year ended December 31, 2024, net cash provided by financing activities of $133.9 million was primarily due to the $131.0 million of net proceeds we received from the IPO. For the year ended December 31, 2023, net cash provided by financing activities of $77.7 million was due to capital contributions from BIHL.
Reinsurance
We purchase various forms of reinsurance to manage loss exposures and safeguard our capital. Through reinsurance, we transfer certain exposures to a reinsurer, and in return, the reinsurer receives a portion of the premium, less a ceding commission paid to us. We strategically use a combination of quota share and excess of loss reinsurance treaties to retain risk, while providing balance sheet protection from larger losses. We may also place facultative reinsurance on specific risks we deem prudent.
A quota share reinsurance treaty is an agreement where reinsurers assume a percentage of the company’s losses in exchange for a negotiated percentage of premium. An excess of loss reinsurance treaty is an agreement where reinsurers agree to assume a portion of losses for a specific event in excess of a specified amount in return for a negotiated premium. Reinsurance needs are determined with principal input from our Chief Underwriting Officer, based on a multitude of factors, including risk appetite, market conditions, loss history and reinsurance capacity.
We place reinsurance through our insurance company subsidiary, BICI, which reinsures 100% of the premium placed by BSUI with the AmFam Issuing Carriers. In turn, BICI strategically transfers exposures to third-party reinsurers utilizing different structures depending on the line of business.
We generally offer up to $15 million of limit on our insurance policies and seek not to retain more than $5 million, utilizing reinsurance to achieve that objective. At each renewal, we consider various factors when determining our reinsurance coverage, including (i) plans to change the underlying insurance coverage we offer, (ii) trends in loss activity, (iii) the level of our capital and surplus, (iv) changes in our risk appetite and (v) the cost, terms and availability of reinsurance coverage. We may adjust our reinsurance program, including our levels of retention based on these factors.
As of December 31, 2024, we had the following significant reinsurance programs:
•For all lines, except Cyber, we use a quota share reinsurance treaty, where 25.0% of the exposure is ceded to reinsurers, and an excess of loss reinsurance treaty, which cedes 60.1% of losses in excess of $5 million up to $15 million to our reinsurers.
•Cyber, as a specialized line of business, is placed under a separate quota share structure, where we cede 64.0% of the exposure to reinsurers. There is no separate excess of loss reinsurance program for our Cyber line of business.
•We also entered into a quota share treaty, effective March 1, 2024, covering commercial auto exposure in excess of $1 million up to $5 million within our Casualty book of business.
Our reinsurance treaties are currently subject to caps, which currently range from 250% to 350% of the subject matter ceded premium, and should these caps be exceeded we would retain any losses in excess of those caps.
Our reinsurance treaties typically have 12- or 18-month terms. While we intend to renew on similar terms as expiring to maintain our desired level of net risk appetite, during each renewal cycle, we may change our coverage terms or the composition of our reinsurance panel. Currently, the quota share reinsurance treaty for Cyber generally renews on January 1, 2025 while the remainder of our reinsurance treaties renew on May 1, 2025.
65
All reinsurance involves credit risk, since we maintain the direct obligation to pay losses incurred by our policyholders up to our policy limits. Accordingly, when selecting our reinsurers, a potential reinsurer’s financial strength is the paramount consideration. All of our reinsurance business is placed with reinsurers that have an A.M. Best rating of “A” (Excellent) or better. As of December 31, 2024, we have never had an allowance for uncollectible reinsurance.
The following table summarizes our top five reinsurers, their A.M. Best financial strength rating and percent of our total reinsurance recoverables as of December 31, 2024:
| Reinsurer | A.M. Best Rating | % of Total | ||||||||||||
| Renaissance Reinsurance U.S. Inc | A+ | 29.8% | ||||||||||||
| Endurance Assurance Corporation | A+ | 23.8% | ||||||||||||
| Markel Global Reinsurance Company | A | 20.8% | ||||||||||||
| Ascot Bermuda Limited | A | 9.4% | ||||||||||||
| American Family Connect Property and Casualty Insurance Company | A | 7.5% | ||||||||||||
| All other reinsurers | At least A | 8.7% | ||||||||||||
| Total | 100.0% | |||||||||||||
Contractual Obligations and Commitments
We have entered into software service agreements that have purchase obligations depending on the amount of premiums written. The fixed and determinable portion of these purchase obligations were approximately $1.7 million for the years 2025 - 2028 as of December 31, 2024. The obligations may increase depending on the amount of premium written by the Company over the respective years.
We have entered into a sublease agreement for our office in New York and a lease agreement for our office in Chicago. On December 1, 2024, the company exercised its option to extend the Chicago lease, which will expire on August 31, 2028, with a renewal option to extend. These leases are classified as operating leases. These leases expire in December 2027 and August 2028, respectively. Although each operating lease agreement contains an option to extend the length of the respective lease term, the Company is not reasonably certain it will exercise these options. As of December 31, 2024, the discounted operating lease liability was $4.3 million.
Financial Condition
Mezzanine equity and stockholders’ equity
As of December 31, 2024, total mezzanine equity and stockholders’ equity was $370.4 million compared to $192.1 million as of December 31, 2023. The $178.4 million increase was primarily due to the $131.0 million of net proceeds received from the IPO and $38.2 million of net income generated during the year.
Dividend declarations
We did not declare any dividends during the years ended December 31, 2024 and 2023.
Investment portfolio
We seek to maintain a diversified portfolio of fixed income instruments that prioritize capital preservation, with a secondary focus on generating predictable investment income. Our asset allocation strategy focuses on high-quality fixed income instruments, with no equity or alternative investment exposure. One of the primary features of our asset allocation is maintaining sufficient readily available funds to pay claims and expenses. Our portfolio consists entirely of cash, cash equivalents, short-term investments and investment grade fixed income securities.
66
We actively manage and monitor our investment risk, balancing the goals of capital preservation and income generation with our need to comply with relevant insurance regulatory frameworks and the capital framework agreements with AmFam. Our board of directors reviews and approves our investment policy and strategy on a regular basis, and considers investment activities, performance against benchmarks and new investment opportunities as they arise.
As of December 31, 2024, the majority of our investment portfolio, or $880.0 million, was comprised of fixed maturity securities that are classified as available-for-sale and carried at fair value with unrealized gains (losses) recognized in accumulated other comprehensive loss within our Consolidated Balance Sheets. Also included in our investment portfolio were $10.0 million of short-term investments. Our fixed maturity securities, including cash equivalents, had a weighted average effective duration of 2.2 years and an average rating of “AA” at December 31, 2024. Our fixed income investment portfolio had a book yield of 4.6% and a market yield of 4.9% as of December 31, 2024, compared to 4.3% and 5.2%, respectively, as of December 31, 2023.
As of December 31, 2024 and 2023, the amortized cost and estimated fair value of our fixed maturity and short-term investments were as follows:
| As of December 31, 2024 | Amortized Cost |
Fair Value |
% of Total Fair Value |
|||||||||||||||||
($ in thousands, except percentages) |
||||||||||||||||||||
| Fixed maturity securities | ||||||||||||||||||||
| U.S. government and government agency | $ | 204,205 | $ | 204,412 | 23.0 | % | ||||||||||||||
| State and municipal | 73,289 | 67,784 | 7.6 | % | ||||||||||||||||
| Commercial mortgage-backed securities | 83,029 | 82,438 | 9.3 | % | ||||||||||||||||
| Residential mortgage-backed securities | 197,589 | 192,103 | 21.6 | % | ||||||||||||||||
| Asset-backed securities | 121,155 | 120,577 | 13.5 | % | ||||||||||||||||
| Corporate | 214,878 | 212,675 | 23.9 | % | ||||||||||||||||
Total fixed maturity securities |
$ | 894,145 | $ | 879,989 | 98.9 | % | ||||||||||||||
Short-term investments |
9,961 | 9,997 | 1.1 | % | ||||||||||||||||
Total investments |
$ | 904,106 | $ | 889,986 | 100.0 | % | ||||||||||||||
| As of December 31, 2023 | Amortized Cost | Fair Value | % of Total Fair Value | |||||||||||||||||
| ($ in thousands, except percentages) | ||||||||||||||||||||
| Fixed maturity securities | ||||||||||||||||||||
| U.S. government and government agency | $ | 252,294 | $ | 252,541 | 44.8 | % | ||||||||||||||
| State and municipal | 55,984 | 50,720 | 9.0 | % | ||||||||||||||||
| Commercial mortgage-backed securities | 26,573 | 25,436 | 4.5 | % | ||||||||||||||||
| Residential mortgage-backed securities | 79,032 | 74,702 | 13.3 | % | ||||||||||||||||
| Asset-backed securities | 42,964 | 42,033 | 7.5 | % | ||||||||||||||||
| Corporate | 112,166 | 109,192 | 19.4 | % | ||||||||||||||||
| Total fixed maturity securities | $ | 569,013 | $ | 554,624 | 98.4 | % | ||||||||||||||
| Short-term investments | 8,830 | 8,824 | 1.6 | % | ||||||||||||||||
| Total investments | $ | 577,843 | $ | 563,448 | 100.0 | % | ||||||||||||||
67
The table below summarizes the credit quality of our fixed maturity securities as of December 31, 2024 and 2023:
Years Ended December 31, |
||||||||||||||||||||||||||
| 2024 | 2023 | |||||||||||||||||||||||||
| Fair Value | % of Total Fair Value | Fair Value | % of Total Fair Value | |||||||||||||||||||||||
| ($ in thousands, except percentages) | ||||||||||||||||||||||||||
| Rating | ||||||||||||||||||||||||||
| AAA | $ | 247,433 | 28.1 | % | $ | 101,648 | 18.3 | % | ||||||||||||||||||
| AA | 385,358 | 43.8 | % | 338,369 | 61.0 | % | ||||||||||||||||||||
| A | 178,775 | 20.3 | % | 76,849 | 13.9 | % | ||||||||||||||||||||
| BBB | 68,423 | 7.8 | % | 37,758 | 6.8 | % | ||||||||||||||||||||
| Total | $ | 879,989 | 100.0 | % | $ | 554,624 | 100.0 | % | ||||||||||||||||||
As of December 31, 2024 and 2023, the amortized cost and estimated fair value of our available-for-sale investments in fixed maturity securities summarized by contractual maturity were as follows:
| As of December 31, 2024 | Amortized Cost | Fair Value | % of Total Fair Value | |||||||||||||||||
| ($ in thousands, except percentages) | ||||||||||||||||||||
| Fixed maturity securities: | ||||||||||||||||||||
| Due in one year or less | $ | 206,764 | $ | 206,721 | 23.5 | % | ||||||||||||||
| Due after one year through five years | 208,179 | 205,012 | 23.3 | % | ||||||||||||||||
| Due after five years through ten years | 45,230 | 43,199 | 4.9 | % | ||||||||||||||||
| Due after ten years | 32,199 | 29,939 | 3.4 | % | ||||||||||||||||
| 492,372 | 484,871 | 55.1 | % | |||||||||||||||||
| Commercial mortgage-backed securities | 83,029 | 82,438 | 9.4 | % | ||||||||||||||||
| Residential mortgage-backed securities | 197,589 | 192,103 | 21.8 | % | ||||||||||||||||
| Asset-backed securities | 121,155 | 120,577 | 13.7 | % | ||||||||||||||||
| Total | $ | 894,145 | $ | 879,989 | 100.0 | % | ||||||||||||||
| As of December 31, 2023 | Amortized Cost | Fair Value | % of Total Fair Value | |||||||||||||||||
| ($ in thousands, except percentages) | ||||||||||||||||||||
| Fixed maturity securities: | ||||||||||||||||||||
| Due in one year or less | $ | 254,656 | $ | 254,443 | 45.9 | % | ||||||||||||||
| Due after one year through five years | 122,274 | 118,585 | 21.4 | % | ||||||||||||||||
| Due after five years through ten years | 27,145 | 25,265 | 4.6 | % | ||||||||||||||||
| Due after ten years | 16,369 | 14,160 | 2.6 | % | ||||||||||||||||
| 420,444 | 412,453 | 74.4 | % | |||||||||||||||||
| Commercial mortgage-backed securities | 26,573 | 25,436 | 4.6 | % | ||||||||||||||||
| Residential mortgage-backed securities | 79,032 | 74,702 | 13.5 | % | ||||||||||||||||
| Asset-backed securities | 42,964 | 42,033 | 7.6 | % | ||||||||||||||||
| Total | $ | 569,013 | $ | 554,624 | 100.0 | % | ||||||||||||||
Expected maturities may differ from contractual maturities because borrowers may have the right to call or prepay obligations with or without call or prepayment penalties, and the lenders may have the right to put the securities back to the borrower.
68
Restricted Assets
We are required to maintain assets in trust accounts to support the obligations of the AmFam Quota Share Agreement. The assets held in trust include fixed maturity securities, short-term investments and cash and cash equivalents, as collateral for transactions with AmFam. The Company is entitled to interest income earned on these restricted assets, which is included in net investment income in the Consolidated Statements of Income and Comprehensive Income (Loss).
The fair value of our restricted assets were as follows:
As of December 31, |
2024 | 2023 | ||||||||||||
| ($ in thousands) | ||||||||||||||
| Restricted investments | $ | 494,828 | $ | 284,822 | ||||||||||
| Restricted cash and cash equivalents | 124,582 | 1,698 | ||||||||||||
Total restricted assets |
$ | 619,411 | $ | 286,520 | ||||||||||
Critical Accounting Policies and Estimates
We identified the following accounting estimates as critical to the understanding of our financial position and results of operations:
•reserve for losses and loss adjustment expenses;
•reinsurance recoverable;
•fair value measurements of financial assets and liabilities; and
•deferred income tax.
Critical accounting estimates are defined as those estimates that are both important to the portrayal of our financial condition and results of operations and require us to exercise significant judgment. We use significant judgment concerning future results and developments in applying these critical accounting estimates and in preparing our consolidated financial statements. These judgments and estimates affect our reported amounts of assets, liabilities, revenues and expenses and the disclosure of our material contingent assets and liabilities. Actual results may differ materially from the estimates and assumptions used in preparing the consolidated financial statements. We evaluate our estimates regularly using information that we believe to be relevant. For a detailed discussion of our accounting policies, see Note 2, “Significant Accounting Policies,” in our Notes to Consolidated Financial Statements included in this Annual Report on Form 10-K.
Reserve for losses and loss adjustment expenses
Reserve for losses and loss adjustment expenses represents our estimated ultimate cost of all reported and unreported losses and loss adjustment expenses incurred and unpaid at the balance sheet date. We do not discount our reserves for losses to reflect estimated present value. We estimate the reserves using individual case-basis valuations of reported claims and various actuarial procedures. Those estimates are based on our historical information, industry and peer group information and our estimates of future trends in variable factors such as loss severity, loss frequency and other factors such as inflation. We regularly review our estimates and adjust them as necessary as experience develops or as new information becomes known to us. Additionally, during the loss settlement period, it often becomes necessary to refine and adjust the estimates of liability on a claim either upward or downward. Even after such adjustments, the ultimate liability may exceed or be less than the revised estimates. Accordingly, the ultimate settlement of losses and loss adjustment expenses may vary significantly from the estimate included in our consolidated financial statements.
We categorize our reserves for unpaid losses and loss adjustment expenses into two types: case reserves and reserves for IBNR.
69
Case reserves are established for individual claims that have been reported to us. We are notified of losses by our insureds, their agents or our brokers. Based on the information provided, we establish case reserves by estimating the ultimate losses from the claim, including defense costs associated with the ultimate settlement of the claim. Our claims department personnel use their knowledge of the specific claim along with advice from internal and external experts, including underwriters and legal counsel, to estimate the expected ultimate losses.
With the assistance of an independent actuarial firm, we estimate the cost of losses and loss adjustment expenses related to IBNR based on an analysis of several commonly accepted actuarial loss projection methodologies. The IBNR that we book represents management’s best estimate.
The following tables summarize our gross and net reserves for unpaid losses and loss adjustment expenses as of December 31, 2024 and 2023:
| Year Ended December 31, 2024 | |||||||||||||||||||||||
| Gross | % of Total | Net | % of Total | ||||||||||||||||||||
| ($ in thousands, except percentages) | |||||||||||||||||||||||
| Case reserves | $ | 71,420 | 9.4 | % | $ | 47,378 | 9.3 | % | |||||||||||||||
| IBNR | 685,439 | 90.6 | % | 462,566 | 90.7 | % | |||||||||||||||||
| Total reserves | $ | 756,859 | 100.0 | % | $ | 509,944 | 100.0 | % | |||||||||||||||
| Year Ended December 31, 2023 | |||||||||||||||||||||||
| Gross | % of Total | Net | % of Total | ||||||||||||||||||||
| ($ in thousands, except percentages) | |||||||||||||||||||||||
| Case reserves | $ | 22,616 | 5.2 | % | $ | 18,063 | 6.1 | % | |||||||||||||||
| IBNR | 408,570 | 94.8 | % | 276,850 | 93.9 | % | |||||||||||||||||
| Total reserves | $ | 431,186 | 100.0 | % | $ | 294,913 | 100.0 | % | |||||||||||||||
The process of estimating the reserve for losses and loss adjustment expenses requires a high degree of judgment and is subject to several variables. In establishing the quarterly actuarial recommendation for the reserve for losses and loss adjustment expenses, consideration is given to several actuarial methods. A first step is to select an initial expected ultimate loss and allocated loss adjustment expense (“ALAE”) ratio for each reserving group. This is done with assistance from our actuarial consultants. Consideration is given to inputs from our underwriting and claims departments, internal pricing data and industry benchmarks provided by our actuarial consultants. The actuarial methods utilize, to varying degrees, the initial expected loss ratio, analysis of industry and internal claims reporting and payment patterns, paid and reported experience, industry loss experience and changes in market conditions, policy forms, exclusions and exposures. The actuarial methods used to estimate loss and loss adjustment expense reserves are:
•Reported and/or Paid Loss Development Methods — Ultimate losses are estimated based on historical or industry loss reporting (or payout) patterns applied to current reported (or paid) loss and ALAE. Reported losses are the sum of paid and case losses. When there is insufficient historical data, industry development patterns are used.
•Reported and/or Paid Bornhuetter-Ferguson Method — Ultimate losses are estimated as the sum of cumulative reported (or paid) losses and estimated IBNR (or unpaid) losses. IBNR (or unpaid) losses are estimated based on historical or industry reporting (or payout) development patterns and the initial expected ultimate loss and ALAE ratio.
•Reported and/or Paid Cape Cod Method — Ultimate losses are estimated as the sum of cumulative reported (or paid) losses and estimated IBNR (or unpaid) losses. IBNR (or unpaid) losses are estimated based on historical or industry reporting (or payout) development patterns and a loss + ALAE ratio based on adjusted experience to date.
70
Since our loss experience is less mature, we are primarily relying on a weighting between the initial expected loss and ALAE ratio and the indications resulting from the Reported Bornhuetter-Ferguson and Cape Cod Methods.
Our reserves are driven by several important factors, including litigation and regulatory trends, legislative activity, climate change, social and economic patterns, and claims inflation assumptions. Our reserve estimates reflect current inflation in legal claims’ settlements and assume we will not be subject to losses from significant new legal liability theories. Our reserve estimates assume that there will not be significant changes in the regulatory and legislative environment. The impact of potential changes in the regulatory or legislative environment is difficult to quantify in the absence of specific, significant new regulation or legislation. In the event of significant new regulation or legislation, we will attempt to quantify its impact on our business, but no assurance can be given that our attempt to quantify such inputs will be accurate or successful.
Although we believe that our reserve estimates are reasonable, it is possible that our actual loss experience may not conform to our assumptions. Specifically, our actual ultimate loss ratio could differ from our initial expected loss ratio, or our actual reporting and payment patterns could differ from our expected reporting and payment patterns, which are based on our own data and industry data. Accordingly, the ultimate settlement of losses and the related loss adjustment expenses may vary significantly from the estimates included in our financial statements. We regularly review our estimates and adjust them as necessary as experience develops or as new information becomes known to us. Such adjustments are included in the results of current operations.
The table below quantifies the impact of potential reserve deviations from our carried reserve as of December 31, 2024 and 2023. We applied a sensitivity factor to net reserves for unpaid losses and loss adjustment expenses by underwriting division below. We believe that potential changes such as these would not have a material impact on our liquidity.
Potential Impact as of December 31, 2024 |
||||||||||||||||||||||||||||||||||||||||||||
| Underwriting Division | Net Reserves for Unpaid Losses and Loss Adjustment Expenses | 7.5% Higher | Pre-tax Income |
Mezzanine Equity and Stockholders’ Equity(1)
|
7.5% Lower | Pre-tax Income |
Mezzanine Equity and Stockholders’ Equity(1)
|
|||||||||||||||||||||||||||||||||||||
| ($ in thousands) | ||||||||||||||||||||||||||||||||||||||||||||
| Casualty | $ | 311,115 | $ | 334,449 | $ | (23,334) | $ | (18,434) | $ | 287,781 | $ | 23,334 | $ | 18,434 | ||||||||||||||||||||||||||||||
| Professional Liability | 119,741 | 128,722 | (8,981) | (7,095) | 110,760 | 8,981 | 7,095 | |||||||||||||||||||||||||||||||||||||
| Healthcare Liability | 78,925 | 84,844 | (5,919) | (4,676) | 73,006 | 5,919 | 4,676 | |||||||||||||||||||||||||||||||||||||
| Baleen Specialty | 163 | 175 | (12) | (10) | 151 | 12 | 10 | |||||||||||||||||||||||||||||||||||||
Potential Impact as of December 31, 2023 |
||||||||||||||||||||||||||||||||||||||||||||
| Underwriting Division | Net Reserves for Unpaid Losses and Loss Adjustment Expenses | 7.5% Higher | Pre-tax Income |
Mezzanine Equity and Stockholders’ Equity(1)
|
7.5% Lower | Pre-tax Income |
Mezzanine Equity and Stockholders’ Equity(1)
|
|||||||||||||||||||||||||||||||||||||
| ($ in thousands) | ||||||||||||||||||||||||||||||||||||||||||||
| Casualty | $ | 160,708 | $ | 172,761 | $ | (12,053) | $ | (9,522) | $ | 148,655 | $ | 12,053 | $ | 9,522 | ||||||||||||||||||||||||||||||
| Professional Liability | 85,739 | 92,169 | (6,430) | (5,080) | 79,309 | 6,430 | 5,080 | |||||||||||||||||||||||||||||||||||||
| Healthcare Liability | 48,466 | 52,101 | (3,635) | (2,872) | 44,831 | 3,635 | 2,872 | |||||||||||||||||||||||||||||||||||||
_________________
(1) The U.S. corporate income tax rate of 21% is used to estimate the potential impact to mezzanine equity and stockholders’ equity.
71
The amount by which estimated losses differ from those originally reported for a period is known as “development.” Development is unfavorable when the losses ultimately settle for more than the amount reserved or subsequent estimates indicate a basis for reserve increases on unresolved claims. Development is favorable when losses ultimately settle for less than the amount reserved or subsequent estimates indicate a basis for reducing loss reserves on unresolved claims. We reflect favorable or unfavorable development of loss reserves in the results of operations in the period the estimates are changed.
Reinsurance recoverable
We purchase various forms of reinsurance to manage loss exposures and safeguard our capital. Our reinsurance is primarily contracted under quota-share reinsurance treaties and excess of loss treaties. We may also place facultative reinsurance on specific risks we deem prudent.
A quota share reinsurance treaty is an agreement where reinsurers assume a percentage of the company’s losses in exchange for a negotiated percentage of premium. An excess of loss reinsurance treaty is an agreement where reinsurers agree to assume a portion of losses for a specific event in excess of a specified amount in return for a negotiated premium. The negotiated premium is based on the assessment of the amount of risk being ceded to the reinsurer because the reinsurer does not share proportionately in the ceding company's losses.
The recognition of reinsurance recoverables requires two key estimates as follows:
•The first estimate is the amount of loss reserves to be ceded to our reinsurers. This amount consists of our case reserves and IBNR. See “Reserves for losses and loss adjustment expenses” under “Critical Accounting Policies and Estimates” above and Note 2, “Significant Accounting Policies” in our Notes to Consolidated Financial Statements included in this Annual Report on Form 10-K for further discussion.
•The second estimate is the amount of the reinsurance recoverable balance we believe will ultimately not be collected from reinsurers. We are selective in choosing reinsurers, buying reinsurance from reinsurers with an A.M. Best rating of “A” (Excellent) or better. The amount we ultimately collect may differ from our estimate due to the ability and willingness of reinsurers to pay claims, which may be negatively impacted by factors such as insolvency, contractual disputes over contract language or coverage and/or other reasons. In addition, economic conditions and/or operational performance of a particular reinsurer may deteriorate, and this could also affect the ability and willingness of a reinsurer to meet their contractual obligations
As of December 31, 2024, we believe 100% of our recoverables are collectible and, therefore, the total provision for current expected credit losses recorded against recoverables is not material.
Fair value measurements
Fair value is defined as the price that would be received to sell an asset or paid to transfer a liability in an orderly transaction between market participants at the measurement date. Fair value is determined based on a fair value hierarchy that prioritizes the use of observable inputs over the use of unobservable inputs and requires the use of observable inputs when available. The Company utilizes a fair value hierarchy that prioritizes the inputs to valuation techniques used to measure fair value into three levels, as follows:
▪Level 1: Unadjusted quoted prices in active markets that are accessible at the measurement date for identical assets or liabilities.
▪Level 2: Significant other observable inputs other than Level 1 inputs, such as quoted prices in active markets for similar assets or liabilities, quoted prices in inactive markets for identical assets or liabilities, or other inputs that are directly or indirectly observable through market-corroborated inputs, such as interest rates, yield curves, prepayment speeds, default rates, or loss severities.
▪Level 3: Significant unobservable inputs used to measure fair value to the extent that relevant observable inputs are not available, and that reflect the Company’s best estimate of what hypothetical market participants would use to determine a transaction price for the asset or liability at the measurement date.
72
See Note 4, “Fair Value Measurements”, in our Notes to Consolidated Financial Statements included in this Annual Report on Form 10-K for further discussion regarding our fair value disclosures.
Deferred income taxes
We record deferred income taxes as assets or liabilities on our Consolidated Balance Sheets to reflect the net tax effect of the temporary differences between the carrying amount of assets and liabilities for financial reporting purposes and their respective tax bases. Deferred tax assets and liabilities are measured by applying enacted tax rates in effect for the years in which such differences are expected to reverse. Our deferred tax assets result from temporary differences primarily attributable to unearned premium reserves, unrealized losses on investments and loss reserves. Our deferred tax liabilities result primarily from deferred policy acquisition costs. We review the need for a valuation allowance related to our deferred tax assets each quarter. We reduce our deferred tax assets by a valuation allowance when we determine that it is more likely than not that some portion or all of the deferred tax assets will not be realized. The assessment of whether or not a valuation allowance is needed requires us to use significant judgment. See Note 13, “Income Taxes” in our Notes to Consolidated Financial Statements included in this Annual Report on Form 10-K for further discussion regarding our deferred tax assets and liabilities.
Recent Accounting Pronouncements
See Note 2, “Significant Accounting Policies,” in our Notes to Consolidated Financial Statements included in this Annual Report on Form 10-K for further discussion regarding our recent accounting pronouncements.
ITEM 7A. QUANTITATIVE AND QUALITATIVE DISCLOSURES ABOUT MARKET RISK
Market risk is the risk of economic losses due to adverse changes in the estimated fair value of a financial instrument as the result of changes in interest rates, equity prices, foreign currency exchange rates and commodity prices. The primary component of market risk affecting us is interest rate risk associated with our investments in fixed maturity securities. We do not have material exposure to equity prices, foreign currency exchange rate risk or commodity risk.
Interest rate risk
Interest rate risk is the risk that we will incur economic losses due to adverse changes in interest rates. Fluctuations in interest rates have a direct effect on the market valuation of our fixed maturity securities. When market interest rates rise, the fair value of our securities decreases. Conversely, as interest rates fall, the fair value of our securities increases. Changes in interest rates will have an immediate effect on comprehensive income (loss) and mezzanine equity and stockholders’ equity, but will not ordinarily have an immediate effect on net income. We manage this interest rate risk by investing in securities with varied maturity dates.
We had fixed maturity securities, short-term investments and cash and cash equivalents with a fair value of $1,024.2 million at December 31, 2024 and $567.3 million at December 31, 2023 that were subject to interest rate risk. The table below illustrates the sensitivity of the fair value of our fixed maturity securities, short-term investments and cash and cash equivalents to selected hypothetical changes in interest rates as of December 31, 2024 and 2023.
73
| As of December 31, 2024 | As of December 31, 2023 | |||||||||||||||||||||||||||||||||||||
| Estimated Fair Value | Estimated Change in Fair Value | Estimated % Increase (Decrease) in Fair Value | Estimated Fair Value | Estimated Change in Fair Value | Estimated % Increase (Decrease) in Fair Value | |||||||||||||||||||||||||||||||||
| ($ in thousands, except percentages) | ||||||||||||||||||||||||||||||||||||||
200 basis point increase |
$ | 981,213 | $ | (43,018) | (4.2) | % | $ | 545,278 | $ | (22,070) | (3.9) | % | ||||||||||||||||||||||||||
100 basis point increase |
1,002,312 | (21,919) | (2.1) | % | 556,058 | (11,290) | (2.0) | % | ||||||||||||||||||||||||||||||
No change |
1,024,230 | — | — | % | 567,348 | — | — | % | ||||||||||||||||||||||||||||||
100 basis point decrease |
1,046,354 | 22,123 | 2.2 | % | 578,978 | 11,631 | 2.1 | % | ||||||||||||||||||||||||||||||
200 basis point decrease |
1,067,453 | 43,223 | 4.2 | % | 590,836 | 23,488 | 4.1 | % | ||||||||||||||||||||||||||||||
Actual results may differ from the hypothetical change in market rates assumed in this disclosure. This sensitivity analysis does not reflect the results of any action that we may take to mitigate such hypothetical losses in fair value.
Credit risk
Credit risk is the potential loss resulting from adverse changes in an issuer’s ability to repay its debt obligations. We have exposure to credit risk as a holder of fixed maturity securities. Our investment policy is designed to primarily invest in debt instruments of high credit quality issuers and to manage the amount of credit exposure with limits on particular ratings categories, limits for any one issuer and limits for sectors and regions. We monitor our investment portfolio to ensure that credit risk does not exceed prudent levels. The majority of our investment portfolio is invested in high credit quality, investment grade fixed maturity securities. As of December 31, 2024, our fixed maturity portfolio has an average rating by at least one nationally recognized rating organization of “AA ,” with approximately 93.3% rated “A” or better. We purchase fixed maturity securities based on our assessment of the credit quality of the underlying assets without regard to insurance.
In addition, we are subject to credit risk as we cede a portion of our risks to reinsurers. Although our reinsurers are obligated to reimburse us to the extent we cede risk to them, we are ultimately liable to our policyholders on all risks we have ceded. As a result, reinsurance contracts do not limit our ultimate obligations to pay claims covered under the insurance policies we issue and we might not collect amounts recoverable from our reinsurers. We address this credit risk by selecting reinsurers that have an A.M. Best rating of “A” (Excellent) or better at the time we enter into the agreement and by performing, along with our reinsurance broker, periodic credit reviews of our reinsurers. As of December 31, 2024, 100% of our reinsurance recoverables were either derived from reinsurers rated “A” (Excellent) by A.M. Best, or better.
74
ITEM 8. FINANCIAL STATEMENTS AND SUPPLEMENTARY DATA
Bowhead Specialty Holdings Inc.
INDEX TO FINANCIAL STATEMENTS
Page No. |
||||||||
Audited Financial Statements |
||||||||
Financial Statement Schedules |
||||||||
75
Report of Independent Registered Public Accounting Firm
To the Board of Directors and Stockholders of Bowhead Specialty Holdings Inc.
Opinion on the Financial Statements
We have audited the accompanying consolidated balance sheets of Bowhead Specialty Holdings Inc. and its subsidiaries (the "Company") as of December 31, 2024 and 2023, and the related consolidated statements of income and comprehensive income, of changes in mezzanine equity and stockholders’ equity and of cash flows for each of the three years in the period ended December 31, 2024, including the related notes and financial statement schedules listed in the accompanying index (collectively referred to as the "consolidated financial statements"). In our opinion, the consolidated financial statements present fairly, in all material respects, the financial position of the Company as of December 31, 2024 and 2023, and the results of its operations and its cash flows for each of the three years in the period ended December 31, 2024 in conformity with accounting principles generally accepted in the United States of America.
Basis for Opinion
These consolidated financial statements are the responsibility of the Company’s management. Our responsibility is to express an opinion on the Company’s consolidated financial statements based on our audits. We are a public accounting firm registered with the Public Company Accounting Oversight Board (United States) (PCAOB) and are required to be independent with respect to the Company in accordance with the U.S. federal securities laws and the applicable rules and regulations of the Securities and Exchange Commission and the PCAOB.
We conducted our audits of these consolidated financial statements in accordance with the standards of the PCAOB. Those standards require that we plan and perform the audits to obtain reasonable assurance about whether the consolidated financial statements are free of material misstatement, whether due to error or fraud. The Company is not required to have, nor were we engaged to perform, an audit of its internal control over financial reporting. As part of our audits we are required to obtain an understanding of internal control over financial reporting but not for the purpose of expressing an opinion on the effectiveness of the Company's internal control over financial reporting. Accordingly, we express no such opinion.
Our audits included performing procedures to assess the risks of material misstatement of the consolidated financial statements, whether due to error or fraud, and performing procedures that respond to those risks. Such procedures included examining, on a test basis, evidence regarding the amounts and disclosures in the consolidated financial statements. Our audits also included evaluating the accounting principles used and significant estimates made by management, as well as evaluating the overall presentation of the consolidated financial statements. We believe that our audits provide a reasonable basis for our opinion.
/s/ PricewaterhouseCoopers LLP
Chicago, Illinois
February 27, 2025
We have served as the Company’s auditor since 2022.
76
| December 31, | |||||||||||
| 2024 | 2023 | ||||||||||
| ($ in thousands, except share data) | |||||||||||
| Assets | |||||||||||
| Investments | |||||||||||
Fixed maturity securities, available for sale, at fair value (amortized cost of $ |
$ | $ | |||||||||
| Short-term investments, at amortized cost, which approximates fair value | |||||||||||
Total investments |
|
|
|||||||||
| Cash and cash equivalents | |||||||||||
| Restricted cash and cash equivalents | |||||||||||
| Accrued investment income | |||||||||||
| Premium balances receivable | |||||||||||
| Reinsurance recoverable | |||||||||||
| Prepaid reinsurance premiums | |||||||||||
| Deferred policy acquisition costs | |||||||||||
| Property and equipment, net | |||||||||||
| Income taxes receivable | |||||||||||
| Deferred tax assets, net | |||||||||||
| Other assets | |||||||||||
Total assets |
$ |
|
$ |
|
|||||||
| Liabilities | |||||||||||
| Reserve for losses and loss adjustment expenses | $ | $ | |||||||||
| Unearned premiums | |||||||||||
| Reinsurance balances payable | |||||||||||
| Income taxes payable | |||||||||||
| Accrued expenses | |||||||||||
| Other liabilities | |||||||||||
Total liabilities |
|
|
|||||||||
| Commitments and contingencies (Note 14) | |||||||||||
| Mezzanine equity | |||||||||||
| Performance stock units | |||||||||||
| Stockholders' equity | |||||||||||
| Common stock | |||||||||||
($ |
|||||||||||
| Additional paid-in capital | |||||||||||
| Accumulated other comprehensive loss | ( |
( |
|||||||||
| Retained earnings | |||||||||||
Total stockholders' equity |
|
|
|||||||||
| Total mezzanine equity and stockholders' equity |
|
|
|||||||||
Total liabilities, mezzanine equity and stockholders' equity |
$ |
|
$ |
|
|||||||
See accompanying Notes to Consolidated Financial Statements.
77
Bowhead Specialty Holdings Inc.
Consolidated Statements of Income and Comprehensive Income (Loss)
| Years Ended December 31, | |||||||||||||||||
| 2024 | 2023 | 2022 | |||||||||||||||
| ($ in thousands, except share and per share data) | |||||||||||||||||
Revenues |
|||||||||||||||||
| Gross written premiums | $ | $ | $ | ||||||||||||||
| Ceded written premiums | ( |
( |
( |
||||||||||||||
Net written premiums |
|
|
|
||||||||||||||
Change in net unearned premiums |
( |
( |
( |
||||||||||||||
Net earned premiums |
|
|
|
||||||||||||||
| Net investment income | |||||||||||||||||
| Net realized investment losses | ( |
||||||||||||||||
Other insurance-related income |
|||||||||||||||||
Total revenues |
|
|
|
||||||||||||||
| Expenses | |||||||||||||||||
Net losses and loss adjustment expenses |
|||||||||||||||||
| Net acquisition costs | |||||||||||||||||
| Operating expenses | |||||||||||||||||
| Non-operating expenses | |||||||||||||||||
| Warrant expense | |||||||||||||||||
| Credit facility interest expenses and fees | |||||||||||||||||
| Foreign exchange losses (gains) | ( |
||||||||||||||||
Total expenses |
|
|
|
||||||||||||||
Income before income taxes |
|
|
|
||||||||||||||
Income tax expense |
( |
( |
( |
||||||||||||||
Net income |
$ |
|
$ |
|
$ |
|
|||||||||||
| Other comprehensive income (loss) | |||||||||||||||||
Change in unrealized loss on investments (net of income tax (expense) of $( |
( |
||||||||||||||||
| Total comprehensive income (loss) | $ |
|
$ |
|
$ | ( |
|||||||||||
| Earnings per share: | |||||||||||||||||
| Basic | $ | $ | $ | ||||||||||||||
| Diluted | $ | $ | $ | ||||||||||||||
| Weighted average shares outstanding: | |||||||||||||||||
| Basic | |||||||||||||||||
| Diluted | |||||||||||||||||
See accompanying Notes to Consolidated Financial Statements.
78
Bowhead Specialty Holdings Inc.
Consolidated Statements of Changes in Mezzanine Equity and Stockholders’ Equity
| Common Stock | Mezzanine Equity | Additional Paid-in Capital | Accumulated Other Comprehensive Loss | Retained (Deficit) Earnings | Total Mezzanine Equity and Stockholders' Equity | ||||||||||||||||||||||||||||||||||||
| Number of Shares | Amount | ||||||||||||||||||||||||||||||||||||||||
| ($ in thousands, except share data) | |||||||||||||||||||||||||||||||||||||||||
| Balance, January 1, 2022 | $ |
|
$ |
|
$ |
|
$ | ( |
$ | ( |
$ |
|
|||||||||||||||||||||||||||||
| Net income | — | — | — | — | — |
|
|
||||||||||||||||||||||||||||||||||
| Other comprehensive loss, net of tax | — | — | — | — | ( |
— | ( |
||||||||||||||||||||||||||||||||||
| Capital contribution from parent | — | — | — |
|
— | — |
|
||||||||||||||||||||||||||||||||||
| Capital distribution to parent | — | — | — | ( |
— | — | ( |
||||||||||||||||||||||||||||||||||
| Share-based compensation expense | — | — | — |
|
— | — |
|
||||||||||||||||||||||||||||||||||
| Balance, December 31, 2022 | $ |
|
$ |
|
$ |
|
$ | ( |
$ | ( |
$ |
|
|||||||||||||||||||||||||||||
| Net income | — | — | — | — | — |
|
|
||||||||||||||||||||||||||||||||||
| Other comprehensive income, net of tax | — | — | — | — |
|
— |
|
||||||||||||||||||||||||||||||||||
| Capital contribution from parent | — | — | — |
|
— | — |
|
||||||||||||||||||||||||||||||||||
| Capital distribution to parent | — | — | — | — | — | — |
|
||||||||||||||||||||||||||||||||||
| Stock-based compensation expense | — | — | — |
|
— | — |
|
||||||||||||||||||||||||||||||||||
| Balance, December 31, 2023 | $ |
|
$ |
|
$ |
|
$ | ( |
$ |
|
$ |
|
|||||||||||||||||||||||||||||
| Net income | — | — | — | — | — | ||||||||||||||||||||||||||||||||||||
| Other comprehensive income, net of tax | — | — | — | — | — | ||||||||||||||||||||||||||||||||||||
| Capital contribution from parent | — | — | — | — | — | ||||||||||||||||||||||||||||||||||||
| Capital distribution to parent | — | — | — | — | — | — | |||||||||||||||||||||||||||||||||||
| Issuance of common stock under stock-based compensation plan | — | — | — | — | |||||||||||||||||||||||||||||||||||||
| Stock-based compensation expense | — | — | — | — | |||||||||||||||||||||||||||||||||||||
| Warrant expense | — | — | — | — | — | ||||||||||||||||||||||||||||||||||||
| Proceeds from initial public offering, net | — | — | — | ||||||||||||||||||||||||||||||||||||||
| Balance, December 31, 2024 | $ |
|
$ |
|
$ |
|
$ | ( |
$ |
|
$ |
|
|||||||||||||||||||||||||||||
See accompanying Notes to Consolidated Financial Statements.
79
| Years Ended December 31, | |||||||||||||||||
| 2024 | 2023 | 2022 | |||||||||||||||
| ($ in thousands) | |||||||||||||||||
| Cash flows from operating activities: | |||||||||||||||||
Net income |
$ | $ | $ | ||||||||||||||
Adjustments to reconcile net income to net cash provided by operating activities: |
|||||||||||||||||
| Net realized investment losses | |||||||||||||||||
| Amortization of premium/discounts on fixed maturity securities | ( |
( |
( |
||||||||||||||
| Stock‐based compensation | |||||||||||||||||
| Depreciation and amortization | |||||||||||||||||
| Non-cash lease expense | |||||||||||||||||
| Deferred income taxes | ( |
( |
( |
||||||||||||||
| Warrant expense | |||||||||||||||||
| Net changes in operating assets and liabilities: | |||||||||||||||||
| Accrued investment income | ( |
( |
( |
||||||||||||||
| Premium balances receivable | ( |
( |
( |
||||||||||||||
| Reinsurance recoverable | ( |
( |
( |
||||||||||||||
| Prepaid reinsurance premiums | ( |
( |
( |
||||||||||||||
| Deferred policy acquisition costs | ( |
( |
( |
||||||||||||||
| Income taxes receivable | ( |
||||||||||||||||
| Other assets | ( |
( |
|||||||||||||||
| Reserve for losses and loss expenses | |||||||||||||||||
| Unearned premium | |||||||||||||||||
| Reinsurance balances payable | |||||||||||||||||
| Accrued expenses | |||||||||||||||||
| Income taxes payable | ( |
||||||||||||||||
| Other liabilities | ( |
( |
|||||||||||||||
Net cash provided by operating activities |
|
|
|
||||||||||||||
| Net cash used in investing activities | |||||||||||||||||
| Purchases of: | |||||||||||||||||
| Fixed maturity securities | ( |
( |
( |
||||||||||||||
| Short-term investments | ( |
( |
( |
||||||||||||||
| Proceeds from the sale and maturity of: | |||||||||||||||||
| Fixed maturity securities | |||||||||||||||||
| Short-term investments | |||||||||||||||||
| Purchase of property and equipment, net | ( |
( |
( |
||||||||||||||
Net cash used in investing activities |
( |
( |
( |
||||||||||||||
| Net cash provided by (used in) financing activities | |||||||||||||||||
| Capital contribution from parent | |||||||||||||||||
| Capital distribution to parent | ( |
||||||||||||||||
| Proceeds from share issuance related to equity awards | |||||||||||||||||
| Proceeds from initial public offering, net | |||||||||||||||||
Net cash provided by (used in) financing activities |
|
|
( |
||||||||||||||
Net change in cash, cash equivalents and restricted cash |
( |
||||||||||||||||
| Cash, cash equivalents and restricted cash, beginning of period | |||||||||||||||||
Cash, cash equivalents and restricted cash, end of period |
$ |
|
$ |
|
$ |
|
|||||||||||
| Reconciliation of restricted cash | |||||||||||||||||
| Cash and cash equivalents | $ | $ | |||||||||||||||
| Restricted cash and cash equivalents | |||||||||||||||||
Total cash and cash equivalents and restricted cash |
$ |
|
$ |
|
|
||||||||||||
| Supplemental disclosures of cash flow information: | |||||||||||||||||
| Income taxes paid | $ | $ | |||||||||||||||
See accompanying Notes to Consolidated Financial Statements.
80
1.Nature of Operations
Bowhead Specialty Holdings Inc. (“BSHI” and, together with its subsidiaries, “the Company”), is a Delaware domiciled insurance holding company that provides commercial specialty property and casualty insurance products in the U.S., focusing on casualty, professional liability and healthcare liability risks, which are primarily written on a non-admitted (or excess and surplus (“E&S”)) basis. On March 19, 2024, the Company amended the certificate of incorporation of Bowhead Holdings Inc. to change the name of the Company to Bowhead Specialty Holdings Inc.
BSHI conducts its business operations through three wholly-owned subsidiaries. Bowhead Specialty Underwriters, Inc. (“BSUI”) is BSHI’s managing general agency, holding a resident insurance license in the State of Texas, and is domiciled in the State of Delaware. Bowhead Insurance Company, Inc. (“BICI”) is BSHI’s insurance company subsidiary licensed and domiciled as an admitted insurer in the State of Wisconsin. Bowhead Underwriting Services, Inc. (“BUSI”) is the Company’s services company domiciled in the State of Delaware.
BSUI is party to three Managing General Agency Agreements (“MGA Agreements”) with Homesite Insurance Company, Homesite Insurance Company of Florida, and Midvale Indemnity Company (together the “AmFam Issuing Carriers”), each of which is a wholly-owned subsidiary of American Family Mutual Insurance Company, S.I., (“AFMIC” and together with its wholly-owned subsidiaries, “AmFam”). AmFam beneficially owns approximately 14.4 % of BSHI’s issued and outstanding common stock as of December 31, 2024. BSUI is also party to third-party broker agreements, allowing the direct payment of premiums from the brokers to BSUI. Through these MGA agreements, BSUI writes premium and provides claim handling services on behalf of the AmFam Issuing Carriers, and BICI assumes 100 % of the premium, net of any inuring third-party reinsurance, through a Quota Share Agreement with AFMIC (the “AmFam Quota Share Agreement”). AmFam receives a ceding fee on net premiums assumed by BICI (“Ceding Fee”). BICI is also party to an Insurance Trust Agreement pursuant to which BICI provides collateral to support the obligations of the AmFam Quota Share Agreement.
Stock Split
On May 9, 2024, the Company effected a 240 thousand-for-1 forward split of issued and outstanding shares of common stock, par value $0.01 per share. As a result of the forward stock split, one hundred (100 24
Initial Public Offering
On May 28, 2024, the Company completed an upsized initial public offering (the “IPO”) with the sale of 8,658,823 shares of common stock at a price to the public of $17.00 per share, including 1,129,411 shares sold upon the exercise in full of the underwriters’ option to purchase additional shares. After underwriter discounts, commissions and offering expenses, net proceeds to the Company from the IPO were approximately $131.0 million.
Prior to our IPO, BSHI was wholly-owned by Bowhead Insurance Holding LP, a Delaware limited partnership (“BIHL”). BIHL’s limited partners included GPC Partners Investments (SPV III) LP (“GPC Fund”), a private equity fund managed by Gallatin Point Capital LLC (“Gallatin Point”), AMFIC, members of Bowhead’s management and other minority investors. Following the IPO, the shares of our common stock held by BIHL were either distributed to BIHL’s limited partners or sold in the secondary offering of common stock on October 25, 2024. Following October 25, 2024, BIHL was no longer a holder of our common stock and on December 3, 2024, BIHL was dissolved.
The Company is organized as a single operating and reportable segment through which it offers a variety of commercial specialty insurance products to a number of markets.
81
2.Significant Accounting Policies
a)Basis of Presentation
The accompanying consolidated financial statements are prepared in accordance with accounting principles generally accepted in the United States of America (“U.S. GAAP”) and include all accounts of the Company and its wholly-owned subsidiaries. All intercompany transactions and balances are eliminated in consolidation.
b)Use of Estimates
The preparation of the financial statements in conformity with U.S. GAAP requires management to make estimates and assumptions that affect the amounts reported in the consolidated financial statements and accompanying notes. Changes in circumstances could cause actual results to differ materially from those estimates. Significant estimates in the Company’s consolidated financial statements include, but are not limited to, reserve for losses and loss adjustment expenses, reinsurance recoverable on unpaid losses and loss adjustment expenses, fair value of investments, and income taxes.
c)Revenue Recognition
The Company recognizes premiums as written at the inception of the policy, which are earned on a pro-rata basis over the policy term. Unearned premium represents the portion of written premiums that relates to unexpired terms of in-force insurance policies. Premium balances receivable include amounts receivable from agents and brokers that are both currently due and amounts not yet due.
d)Cash and Cash Equivalents and Restricted Cash and Cash Equivalents
Cash and cash equivalents comprise of cash held in bank accounts and cash held in short-term securities. The Company considers all highly liquid investments with original maturities of three months or less to be cash equivalents. The carrying value of the Company’s cash and cash equivalents approximates fair value.
Restricted cash is substantially all comprised of funds set aside in accordance with the Insurance Trust Agreement between BICI and AmFam. The carrying value of the Company’s restricted cash approximates fair value.
e)Investments
The Company classifies investments in fixed maturity securities as available for sale, and as such they are carried at estimated fair value. Changes in fair value are recorded as unrealized gains (losses) in accumulated other comprehensive loss. The fair value of fixed maturity securities is generally determined from quotations received from nationally recognized pricing services or when such prices are not available, by reference to other sources (including observed trading levels, pricing curves or matrices).
Short-term investments consist of treasury bills and treasury notes with maturities greater than three months but less than one year at the date of purchase and are valued at amortized cost, which approximates fair value.
Realized investment gains (losses) represent the difference between the amortized cost of securities sold and the proceeds realized upon sale, which are recorded at the trade date. Gains or losses on fixed maturity securities are determined on a specific identification basis.
Net investment income includes interest income as well as the amortization of market premiums and discounts, net of investment management and custody fees.
82
See Note 3 for additional information on investments.
f)Fair Value Measurements
Fair value is defined as the price that would be received to sell an asset or paid to transfer a liability in an orderly transaction between market participants at the measurement date. Fair value is determined based on a fair value hierarchy that prioritizes the use of observable inputs over the use of unobservable inputs and requires the use of observable inputs when available. The Company utilizes a fair value hierarchy that prioritizes the inputs to valuation techniques used to measure fair value into three levels, as follows:
▪Level 1: Unadjusted quoted prices in active markets that are accessible at the measurement date for identical assets or liabilities.
▪Level 2: Significant other observable inputs other than Level 1 inputs, such as quoted prices in active markets for similar assets or liabilities, quoted prices in inactive markets for identical assets or liabilities, or other inputs that are directly or indirectly observable through market-corroborated inputs, such as interest rates, yield curves, prepayment speeds, default rates, or loss severities.
▪Level 3: Significant unobservable inputs used to measure fair value to the extent that relevant observable inputs are not available, and that reflect the Company’s best estimate of what hypothetical market participants would use to determine a transaction price for the asset or liability at the measurement date.
See Note 4 for additional information on fair value disclosures.
g)Deferred Policy Acquisition Costs
Acquisition costs associated with the successful acquisition of new and renewed insurance and reinsurance contracts are deferred and amortized ratably over the terms of the related contracts. Ceding commissions received on ceded reinsurance contracts are netted against acquisition costs and are recognized ratably over the life of the assumed underlying contract. Deferred policy acquisition costs are comprised primarily of broker commissions and Ceding Fees due to AmFam, which are presented net of unearned ceding commissions. Deferred policy acquisition costs are reviewed to determine if they are recoverable from unearned premium and, if not, are charged to expense. Anticipated investment income is considered in determining if a premium deficiency exists. The recoverability of deferred policy acquisition costs is evaluated separately by underwriting division.
See Note 5 for additional information on deferred policy acquisition costs.
h)Reserve for Losses and Loss Adjustment Expenses
The Company’s reserve for losses and loss adjustment expenses are comprised of case reserves and incurred but not reported liabilities (“IBNR”). When a claim is reported, a case reserve is established for the estimated ultimate payment based upon known information about the claim. As more information about the claim becomes available over time, case reserves are adjusted as appropriate. Such adjustments are reflected in the Consolidated Statements of Income and Comprehensive Income (Loss) in the period in which they are determined. Reserves are also established on an aggregate basis to provide for IBNR liabilities and expected loss reserve development on reported claims.
83
See Note 6 for additional information on reserve for losses and loss adjustment expenses.
i)Reinsurance
In the normal course of business, the Company’s insurance company subsidiary, BICI, cedes a portion of its premium to third-party reinsurers through pro rata and excess of loss reinsurance agreements on a treaty or facultative basis. These arrangements reduce the effect of individual or aggregate losses to the Company. Premiums are disclosed in the Consolidated Statements of Income and Comprehensive Income (Loss) net of ceded premiums. Reinsurance premiums, commissions, and ceded unearned premiums on reinsured business are accounted for on a basis consistent with that used in accounting for the original policies issued and the terms of the reinsurance contracts. The Company receives ceding commissions in accordance with certain reinsurance treaties. The ceding commissions are capitalized and amortized as a reduction of underwriting acquisition expenses. The unearned portion of premiums ceded to reinsurers is reported as prepaid reinsurance premiums and earned ratably over the underlying assumed policy term.
j)Property and Equipment, Net
Property and equipment, net, is carried at cost less accumulated depreciation. Depreciation is calculated using the straight-line method over the estimated useful lives of the respective assets which ranges from 3 to 10 years. For certain leasehold improvements, depreciation is calculated over the shorter of the estimated useful lives of the respective assets or the lease term. Expenditures for maintenance and repairs are expensed as incurred. Upon disposition, the asset cost and related depreciation are removed from the accounts and the resulting gain or loss is included in the Company’s Consolidated Statements of Income and Comprehensive Income (Loss).
See Note 16 for additional information on property and equipment.
k)Impairment of Long-Lived Assets
Long-lived assets with finite lives are tested for impairment whenever recognized events or changes in circumstances indicate the carrying value of these assets may not be recoverable. If indicators of impairment are present, fair value is calculated using estimated future cash flows expected to be generated from the use of those assets. An impairment loss is recognized only if the carrying amount of a long-lived asset or asset group is not recoverable and exceeds its fair value. The carrying amount of a long-lived asset or asset group is not recoverable if it exceeds the sum of the undiscounted cash flows expected to result from the use and eventual disposition of the asset or asset group. That assessment is based on the carrying amount of the asset or asset group at the date it is tested for recoverability. An impairment loss is measured as the amount by which the carrying amount of a long-lived asset or asset group exceeds its fair value.
84
l)Leases
The Company has lease agreements for two
On the lease commencement date, for operating leases that have a lease term of more than 12 months, the Company recognizes a lease liability within and a right-of-use (“ROU”) asset within in the Company’s Consolidated Balance Sheets. The liability is initially measured and recognized at the present value of the lease payments at the lease commencement date. The discount rate used to measure the lease liability is the rate implicit in the lease or, if the rate implicit in the lease is not readily determinable, the incremental borrowing rate. The ROU asset is equal to the lease liability, adjusted for any initial direct costs and any lease payments made to the lessor at or before lease commencement.
See Note 17 for additional information on leases.
m)Foreign Exchange
The Company accounts for foreign exchange (gains) losses arising from the remeasurement of a non-U.S. dollar operating expense liability to U.S. dollars. The change in the liability due to the fluctuations in the exchange rate are included within the Consolidated Statements of Income and Comprehensive Income (Loss) at the end of each period.
n)Comprehensive Income (Loss)
Comprehensive income (loss) includes net income and net unrealized investment losses on available for sale fixed maturity investments, net of tax.
o)Income Taxes
The Company accounts for income taxes under the asset and liability method, which requires the recognition of deferred tax assets and deferred tax liabilities for the expected future tax consequences of events that have been included in the financial statements. Deferred tax assets and liabilities are measured using enacted tax rates expected to be applied in the years in which temporary differences are expected to be recovered or settled. The Company reduces deferred tax assets by a valuation allowance to the extent management concludes it is more likely than not that the assets will not be realized.
The Company analyzes its tax filing positions in all of the U.S. federal, state, local and foreign tax jurisdictions where it is required to file income tax returns, as well as for all open tax years in these jurisdictions. The Company evaluates tax positions taken or expected to be taken in the course of preparing an entity’s tax returns to determine whether it is “more-likely-than-not” that each tax position will be sustained by the applicable tax authority. There are no material tax positions taken or expected to be taken that would significantly increase or decrease unrecognized tax benefits within the next twelve months. Interest and penalties related to uncertain tax positions are recorded within operating expenses within the Consolidated Statements of Income and Comprehensive Income (Loss). None of the Company’s federal or state tax income tax returns are currently under examination by the Internal Revenue Service (“IRS”) or state authorities.
See Note 13 for additional information on income taxes.
85
p)Stock-Based Compensation
Class P Interests
BIHL issued Class P Interests to certain employees in connection with the Company’s pre-IPO employee compensation structure. Each Class P Interest is structured as a profit interest award and entitles the employees to profits after the partners of BIHL receive a return of their initial investment. The Class P Interests are accounted for as equity under accounting standards codification (“ASC”) 718, Compensation – Stock Compensation (“ASC 718”). The fair value of the compensation cost incurred under these awards is measured at the date of grant based on the fair value of the award and is recognized as operating expenses within the Consolidated Statements of Income and Comprehensive Income (Loss), using a graded method over the requisite service period. The Company recognizes any award forfeitures when they occur.
2024 Plan
On May 22, 2024, the Company’s Board of Directors (the “Board”) approved and adopted the 2024 Omnibus Incentive Plan (the “2024 Plan”), which provides for the grant of stock options (including incentive stock options (“ISOs”) and nonqualified stock options), stock appreciation rights, restricted stock, restricted stock units (“RSUs”), other stock-based awards, stock bonuses, cash awards and substitute awards.
Under the 2024 Plan, the Company granted RSUs to the Company’s employees and certain Board directors, and performance stock units (“PSUs”) to its chief executive officer (the “CEO”).
Restricted Stock Units
The RSUs are subject to a service condition and are accounted for as equity under ASC 718. The RSUs are valued based on the fair value of the underlying award, which is Bowhead’s common stock, at the date of grant. The Company recognizes the compensation cost for the RSUs on a straight-line basis over the awards’ vesting period as operating expenses within the Company’s Consolidated Statements of Income and Comprehensive Income (Loss). The Company recognizes any award forfeitures when they occur.
Performance Stock Units
The PSUs are subject to both a service and a market condition, and may be settled in cash upon the occurrence of an event that is outside of the Company’s control. The PSUs are accounted for as mezzanine equity on the Company’s Consolidated Balance Sheets under ASC 718 until the vesting date. The PSUs are measured at fair value based on a Monte Carlo simulation model. The Company recognizes the compensation cost for PSUs on a straight-line basis over the award’s vesting period as operating expenses within the Company’s Consolidated Statements of Income and Comprehensive Income (Loss). If the market condition is not achieved, previously recognized compensation expense is not reversed. The Company recognizes any award forfeitures when they occur.
Warrants
On May 22, 2024, the Board approved the issuance of warrants to AFMIC, a related party of the Company, to purchase shares of the Company’s common stock. The warrants are subject to a service condition and are accounted for as equity under ASC 718. The fair value of the warrants are based on Black-Scholes-Merton pricing models. The Company recognizes compensation cost for the warrants on a quarterly basis over the awards’ vesting period as warrant expense within the Company’s Consolidated Statements of Income and Comprehensive Income (Loss). The Company recognizes any award forfeitures when they occur.
See Note 10 for additional information on stock-based compensation.
86
q)Deferred Financing Fees
Costs associated with the establishment of a senior secured revolving credit facility have been deferred and are amortized using the straight-line method over the terms of such instruments. Unamortized deferred financing fees are presented within other assets on the Company’s Consolidated Balance Sheets, and amortization expenses related to such costs are included in credit facility interest expenses and fees in the Company’s Consolidated Statements of Income and Comprehensive Income (Loss).
See Note 8 for additional information on deferred financing fees.
r)Benefit Plans
Pursuant to the terms of the defined contribution Safe Harbor 401(k) Retirement and Savings Plan (“the Plan”), 100 % of employee contributions to the Plan are matched on the first 4.0 % of salary up to the IRS compensation limit. Company contributions are expensed in the year for which the benefit is earned. All participants are allowed to direct the lesser of 100 % of compensation into a pre-tax deferral plan and a Roth 401(k) account, or the maximum permitted by law.
See Note 15 for additional information on benefit plans.
s)Concentrations of Credit Risk
t)Allowance for Credit Losses
The Company’s reinsurance recoverable and premium balances receivable are subject to credit losses. The Company routinely monitors changes in the credit quality and concentration risks of the reinsurance counterparties and the insurance brokers and updates the allowance for credit losses accordingly. For the respective periods ending December 31, 2024 and December 31, 2023, based on the Company's analysis, the allowance for credit loss is determined to be immaterial.
u)Basic and Diluted Earnings Per Share
See Note 11 for the computation of basic and diluted earnings per share.
87
v)Other Insurance-Related Income
Other insurance-related income includes fees associated with the issuance of policies, which are earned on the effective date of the underlying policy, and revenue we receive for providing insurance-related services, which are earned on a pro-rata basis over the service period.
w)Recent Accounting Pronouncements
The Company is an emerging growth company, as defined in the Jumpstart Our Business Startups Act of 2012 (the “JOBS Act”). Under the JOBS Act, emerging growth companies can delay adopting new or revised accounting standards issued subsequent to the enactment of the JOBS Act, until such time as those standards apply to private companies. The Company is provided an option to adopt new or revised accounting guidance as an “emerging growth company” under the JOBS Act either (1) within the same periods as those otherwise applicable to public business entities, or (2) within the same time periods as private companies, including early adoption when permissible.
Recently Adopted Accounting Standards
Accounting Standards Update (“ASU”) 2016-13, Financial Instruments – Credit Losses (Topic 326)
On June 16, 2016, the Financial Accounting Standards Board (“FASB”) issued ASU 2016-13, “Financial Instruments - Credit Losses (Topic 326)” to provide more useful information about the expected credit losses on financial instruments. The update requires a financial asset measured at amortized cost to be presented at the net amount expected to be collected by means of an allowance for credit losses that runs through net income. Credit losses relating to available for sale fixed maturity securities must also be recorded through an allowance for credit losses, which is limited to the amount by which fair value is below amortized cost. The measurement of credit losses on available for sale securities is similar under previous U.S. GAAP, but the update requires the use of the allowance account through which amounts can be reversed, rather than through an irreversible write-down. The FASB has issued additional ASUs on Topic 326 that do not change the core principle of the guidance in ASU 2016-13 but clarify certain aspects of it.
The Company adopted ASU 2016-13 on January 1, 2023, using the modified-retrospective approach. The adoption of this ASU resulted in the recognition of an allowance for credit loss related to the Company’s reinsurance recoverable and premium balances receivable. Because the Company enters into contracts with reinsurers that have A.M. Best ratings of “A” (Excellent) or better and has a history of collecting premium balances receivable, the effect of adoption was not material to the Company’s consolidated financial statements.
ASU 2023-07, Improvements to Reportable Segment Disclosures (Topic 280)
On January 1, 2024, the Company adopted ASU 2023-07, “Improvements to Reportable Segments Disclosures” retrospectively to all prior periods presented in the financial statements. ASU 2023-07 expands public entities’ segment disclosures by requiring disclosure of significant segment expenses that are regularly provided to the chief operating decision maker (“CODM”) and included within each reported measure of segment profit or loss, an amount and description of its composition for other segment items, and interim disclosures of a reportable segment’s profit or loss and assets. All disclosure requirements under ASU 2023-07 are also required for public entities with a single reportable segment.
The adoption of ASU 2023-07 did not have a material impact on the Company’s consolidated financial statements or disclosures, as the Company’s reportable segments and related disclosures already aligned with the new requirements. The Company will continue to evaluate and implement any necessary changes to comply with this guidance.
88
Recently Issued Accounting Standards Not Yet Adopted
ASU 2023-09, Improvements to Income Tax Disclosures (Topic 740)
In December 2023, the FASB issued ASU 2023-09, “Improvements to Income Tax Disclosures” (Topic 740). ASU 2023-09 requires public companies, on an annual basis, to provide enhanced rate reconciliation disclosures, including disclosures of specific categories and additional information that meet a quantitative threshold. This update also requires public companies to provide additional disclosures regarding income taxes paid, including jurisdictional details. The guidance is effective for fiscal years beginning after December 15, 2024. The Company is evaluating the effect of the amendments on its consolidated financial statements and does not expect a material impact on its financial position or results of operations.
ASU 2024-03, Income Statement—Reporting Comprehensive Income—Expense Disaggregation Disclosures (Subtopic 220-40): Disaggregation of Income Statement Expenses
In November 2024, the FASB issued ASU 2024-03, Income Statement—Reporting Comprehensive Income—Expense Disaggregation Disclosures (Subtopic 220-40): Disaggregation of Income Statement Expenses. ASU 2024-03 enhances the transparency of expense information by requiring public business entities to disclose specific types of expenses included in the expense captions presented on the face of the income statement as well as disclosures about selling expenses. The amendments are effective for fiscal years beginning after December 15, 2026. The Company is currently evaluating the impact of this ASU on its financial statement disclosures.
There are no other prospective accounting standards which, upon their effective date, would have a material impact on the Company’s consolidated financial statements.
3.Investments
The following table summarizes the amortized cost and fair value of the Company’s fixed maturity securities, all of which are classified as available for sale:
| Gross Unrealized | ||||||||||||||||||||||||||
| As of December 31, 2024 | Amortized Cost | Gains | Losses | Fair Value | ||||||||||||||||||||||
| ($ in thousands) | ||||||||||||||||||||||||||
Fixed maturity securities |
||||||||||||||||||||||||||
| U.S. government and government agency | $ | $ | $ | ( |
$ | |||||||||||||||||||||
| State and municipal | ( |
|||||||||||||||||||||||||
| Commercial mortgage-backed securities | ( |
|||||||||||||||||||||||||
| Residential mortgage-backed securities | ( |
|||||||||||||||||||||||||
| Asset-backed securities | ( |
|||||||||||||||||||||||||
| Corporate | ( |
|||||||||||||||||||||||||
Total |
$ |
|
$ |
|
$ | ( |
$ |
|
||||||||||||||||||
| Gross Unrealized | ||||||||||||||||||||||||||
| As of December 31, 2023 | Amortized Cost | Gains | Losses | Fair Value | ||||||||||||||||||||||
| ($ in thousands) | ||||||||||||||||||||||||||
Fixed maturity securities |
||||||||||||||||||||||||||
| U.S. government and government agency | $ | $ | $ | ( |
$ | |||||||||||||||||||||
| State and municipal | ( |
|||||||||||||||||||||||||
| Commercial mortgage-backed securities | ( |
|||||||||||||||||||||||||
| Residential mortgage-backed securities | ( |
|||||||||||||||||||||||||
| Asset-backed securities | ( |
|||||||||||||||||||||||||
| Corporate | ( |
|||||||||||||||||||||||||
Total |
$ |
|
$ |
|
$ | ( |
$ |
|
||||||||||||||||||
a)Contractual Maturity of Fixed Maturity Securities
The amortized cost and fair value of fixed maturity securities at December 31, 2024 and 2023, by contractual maturity, are shown below. Actual maturities may differ from contractual maturities because certain issuers may have the right to call or prepay obligations.
| As of December 31, 2024 | Amortized Cost | Fair Value | ||||||||||||
| ($ in thousands) | ||||||||||||||
| Fixed maturity securities | ||||||||||||||
| Due in one year or less | $ | $ | ||||||||||||
| Due after one year through five years | ||||||||||||||
| Due after five years through ten years | ||||||||||||||
| Due after ten years | ||||||||||||||
| Commercial mortgage-backed securities | ||||||||||||||
| Residential mortgage-backed securities | ||||||||||||||
| Asset-backed securities | ||||||||||||||
Total
|
$ |
|
$ |
|
||||||||||
| As of December 31, 2023 | Amortized Cost | Fair Value | ||||||||||||
($ in thousands) |
||||||||||||||
| Fixed maturity securities | ||||||||||||||
| Due in one year or less | $ | $ | ||||||||||||
| Due after one year through five years | ||||||||||||||
| Due after five years through ten years | ||||||||||||||
| Due after ten years | ||||||||||||||
| Commercial mortgage-backed securities | ||||||||||||||
| Residential mortgage-backed securities | ||||||||||||||
| Asset-backed securities | ||||||||||||||
Total |
$ |
|
$ |
|
||||||||||
b)Net Investment Income
The components of net investment income were derived from the following sources:
| Years Ended December 31, | 2024 | 2023 | 2022 | |||||||||||||||||
| ($ in thousands) | ||||||||||||||||||||
| U.S. government and government agency | $ | $ | $ | |||||||||||||||||
| State and municipal | ||||||||||||||||||||
| Commercial mortgage-backed securities | ||||||||||||||||||||
| Residential mortgage-backed securities | ||||||||||||||||||||
| Asset-backed securities | ||||||||||||||||||||
| Corporate | ||||||||||||||||||||
| Short-term investments | ||||||||||||||||||||
| Cash and cash equivalents | ||||||||||||||||||||
Gross investment income |
||||||||||||||||||||
| Investment expenses | ( |
( |
( |
|||||||||||||||||
Net investment income |
$ |
|
$ |
|
$ |
|
||||||||||||||
c)Net Realized Investment Gains or Losses
There were $16.2 thousand net realized losses from the sale of investments for the year ended December 31, 2024 and nil
d)Restricted Assets
The Company is required to maintain assets as collateral in trust accounts to support the obligations of the AmFam Quota Share Agreement. The assets held in trust include fixed maturity securities, short-term investments and restricted cash and cash equivalents. The Company is entitled to interest income earned on these restricted assets, which is included in net investment income in the Consolidated Statements of Income and Comprehensive Income (Loss).
The following table summarizes the value of the Company’s restricted assets disclosed in the Consolidated Balance Sheets:
| As of December 31, | 2024 | 2023 | ||||||||||||
| ($ in thousands) | ||||||||||||||
| U.S. government and government agency | $ | $ | ||||||||||||
| State and municipal | ||||||||||||||
| Commercial mortgage-backed securities | ||||||||||||||
| Residential mortgage-backed securities | ||||||||||||||
| Asset-backed securities | ||||||||||||||
| Corporate | ||||||||||||||
| Restricted fixed maturity securities | ||||||||||||||
| Restricted short-term investments | ||||||||||||||
| Restricted cash and cash equivalents | ||||||||||||||
Restricted assets |
$ |
|
$ |
|
||||||||||
e)Gross Unrealized Losses
The following table summarizes available for sale securities in an unrealized loss position, the fair value and gross unrealized loss by length of time the security has been in a continual unrealized loss position:
| Less than 12 Months | 12 Months or Greater | Total | ||||||||||||||||||||||||||||||||||||
| As of December 31, 2024 | Fair Value | Gross Unrealized Losses | Fair Value | Gross Unrealized Losses | Fair Value | Gross Unrealized Losses | ||||||||||||||||||||||||||||||||
| ($ in thousands) | ||||||||||||||||||||||||||||||||||||||
Fixed maturity securities |
||||||||||||||||||||||||||||||||||||||
| U.S. government and government agency | $ | $ | ( |
$ | $ | $ | $ | ( |
||||||||||||||||||||||||||||||
| State and municipal | ( |
( |
( |
|||||||||||||||||||||||||||||||||||
| Commercial mortgage-backed securities | ( |
( |
( |
|||||||||||||||||||||||||||||||||||
| Residential mortgage-backed securities | ( |
( |
( |
|||||||||||||||||||||||||||||||||||
| Asset-backed securities | ( |
( |
( |
|||||||||||||||||||||||||||||||||||
| Corporate | ( |
( |
( |
|||||||||||||||||||||||||||||||||||
Total |
$ |
|
$ | ( |
$ |
|
$ | ( |
$ |
|
$ | ( |
||||||||||||||||||||||||||
| Less than 12 Months | 12 Months or Greater | Total | ||||||||||||||||||||||||||||||||||||
| As of December 31, 2023 | Fair Value | Gross Unrealized Losses | Fair Value | Gross Unrealized Losses | Fair Value | Gross Unrealized Losses | ||||||||||||||||||||||||||||||||
| ($ in thousands) | ||||||||||||||||||||||||||||||||||||||
Fixed maturity securities |
||||||||||||||||||||||||||||||||||||||
| U.S. government and government agency | $ | $ | ( |
$ | $ | ( |
$ | $ | ( |
|||||||||||||||||||||||||||||
| State and municipal | ( |
( |
( |
|||||||||||||||||||||||||||||||||||
| Commercial mortgage-backed securities | ( |
( |
( |
|||||||||||||||||||||||||||||||||||
| Residential mortgage-backed securities | ( |
( |
( |
|||||||||||||||||||||||||||||||||||
| Asset-backed securities | ( |
( |
( |
|||||||||||||||||||||||||||||||||||
| Corporate | ( |
( |
( |
|||||||||||||||||||||||||||||||||||
Total |
$ |
|
$ | ( |
$ |
|
$ | ( |
$ |
|
$ | ( |
||||||||||||||||||||||||||
All of the securities in an unrealized loss position are rated investment grade. For fixed maturity securities that management does not intend to sell or are required to sell, there is no portion of the decline in value that is considered to be due to credit factors that would be recognized in earnings. Declines in value are considered to be due to non-credit factors and are recognized in Other Comprehensive Income (Loss).
The Company has evaluated its fixed maturity securities in an unrealized loss position and concluded that the unrealized losses are due primarily to temporary market and sector-related factors rather than to issuer-specific factors. None of these securities are delinquent or in default under financial covenants. Based on the assessment of these issuers, the Company expects them to continue to meet their contractual payment obligations as they become due.
89
4.Fair Value Measurements
The Company’s investments in fixed maturity securities, all of which are classified as available for sale, are carried at fair value. All of the Company’s fixed maturity securities investments were priced by independent pricing services. The prices provided by the independent pricing services are estimated based on observable market data in active markets utilizing pricing models and processes, which may include benchmark yields, reported trades, broker/dealer quotes, issuer spreads, two-sided markets, benchmark securities, bids, offers, sector groupings, matrix pricing and reference data. Under certain circumstances, if a vendor price is unavailable, a price may be obtained from a broker. The pricing services may prioritize inputs differently on any given day for any security based on market conditions, and not all inputs are available for each security evaluation on any given day. The pricing services used by the Company have indicated that they will only produce an estimate of fair value if objectively verifiable information is available. The determination of whether markets are active or inactive is based upon the volume and level of activity for a particular asset class.
The fair values of short-term investments approximate their carrying values due to their short-term maturity.
The following table presents the Company’s investments measured at fair value by level:
| As of December 31, 2024 | Level 1 | Level 2 | Level 3 | Total | ||||||||||||||||||||||
| ($ in thousands) | ||||||||||||||||||||||||||
Fixed maturity securities |
||||||||||||||||||||||||||
| U.S. government and government agency | $ | $ | $ | $ | ||||||||||||||||||||||
| State and municipal | ||||||||||||||||||||||||||
| Commercial mortgage-backed securities | ||||||||||||||||||||||||||
| Residential mortgage-backed securities | ||||||||||||||||||||||||||
| Asset-backed securities | ||||||||||||||||||||||||||
| Corporate | ||||||||||||||||||||||||||
Total fixed maturity securities |
|
|
|
|
||||||||||||||||||||||
| Short-term investments | ||||||||||||||||||||||||||
Total investments |
$ |
|
$ |
|
$ |
|
$ |
|
||||||||||||||||||
| As of December 31, 2023 | Level 1 | Level 2 | Level 3 | Total | ||||||||||||||||||||||
| ($ in thousands) | ||||||||||||||||||||||||||
Fixed maturity securities |
||||||||||||||||||||||||||
| U.S. government and government agency | $ | $ | $ | $ | ||||||||||||||||||||||
| State and municipal | ||||||||||||||||||||||||||
| Commercial mortgage-backed securities | ||||||||||||||||||||||||||
| Residential mortgage-backed securities | ||||||||||||||||||||||||||
| Asset-backed securities | ||||||||||||||||||||||||||
| Corporate | ||||||||||||||||||||||||||
Total fixed maturity securities |
|
|
|
|
||||||||||||||||||||||
| Short-term investments | ||||||||||||||||||||||||||
Total investments |
$ |
|
$ |
|
$ |
|
$ |
|
||||||||||||||||||
90
5.Deferred Policy Acquisition Costs
Acquisition costs deferred and amortized to net income for the years ended December 31, 2024, 2023 and 2022 are summarized as follows:
| As of December 31, | 2024 | 2023 | 2022 | |||||||||||||||||
| ($ in thousands) | ||||||||||||||||||||
Deferred policy acquisition costs, beginning of year |
$ | $ | $ | |||||||||||||||||
| Additions to deferred balance: | ||||||||||||||||||||
| Broker commission | ||||||||||||||||||||
| Ceding fee | ||||||||||||||||||||
| Others | ||||||||||||||||||||
| Ceding commission | ( |
( |
( |
|||||||||||||||||
| Total net additions | ||||||||||||||||||||
| Amortization of net policy acquisition costs | ( |
( |
( |
|||||||||||||||||
Deferred policy acquisition costs, end of year |
$ |
|
$ |
|
$ |
|
||||||||||||||
| Years Ended December 31, | 2024 | 2023 | 2022 | |||||||||||||||||
| ($ in thousands) | ||||||||||||||||||||
| Net policy acquisition costs | ||||||||||||||||||||
| Broker commission | $ | $ | $ | |||||||||||||||||
| Ceding fee | ||||||||||||||||||||
| Others | ||||||||||||||||||||
| Ceding commission | ( |
( |
( |
|||||||||||||||||
Amortization of net policy acquisition costs |
$ |
|
$ |
|
$ |
|
||||||||||||||
91
6.Reserve for Losses and Loss Adjustment Expenses
a)Reserve Roll Forward
The table below provides a reconciliation of the beginning and ending reserve balances for the years ended December 31, 2024, 2023 and 2022:
| As of and Years Ended December 31, | 2024 | 2023 | 2022 | |||||||||||||||||
| ($ in thousands) | ||||||||||||||||||||
Gross reserves for losses and loss adjustment expenses, beginning of year |
$ | $ | $ | |||||||||||||||||
Reinsurance recoverable on unpaid losses, beginning of year |
||||||||||||||||||||
Net reserves for unpaid losses and loss adjustment expenses, beginning of year |
$ |
|
$ |
|
$ |
|
||||||||||||||
| Net incurred losses and loss adjustment expenses related to: | ||||||||||||||||||||
| Current accident year | ||||||||||||||||||||
| Prior accident years | ( |
|||||||||||||||||||
| Net paid losses and loss adjustment expenses related to: | ||||||||||||||||||||
| Current accident year | ||||||||||||||||||||
| Prior accident years | ||||||||||||||||||||
Net reserves for unpaid losses and loss adjustment expenses, end of year |
$ |
|
$ |
|
$ |
|
||||||||||||||
| Reinsurance recoverable on unpaid losses, end of year | ||||||||||||||||||||
Gross reserves for losses and loss adjustment expenses, end of year |
$ |
|
$ |
|
$ |
|
||||||||||||||
During the years ended December 31, 2024 and 2023, there were no 2.3 million.
In the fourth quarter of 2024, as part of our annual independent actuarial reserve review, we reallocated prior accident year reserves by division, primarily from Professional Liability to Casualty, to align more closely with industry loss ratios. The increase in our loss ratio and reallocation of prior accident year reserves are primarily based on inputs from industry data due to Bowhead’s limited loss experience.
b)Net Incurred and Paid Claims Development by Accident Year
The Company measures claim frequency information on an individual claim count basis. Any claim that is reported to the Company is included in the count unless it is subsequently settled without liability to the Company.
The following tables disclose by underwriting division, the development of net losses and loss adjustment expenses incurred and paid claims by accident year, IBNR, cumulative number of reported claims and average annual percentage payout of incurred claims by age.
92
The first loss development table within each underwriting division section presents cumulative net losses and loss adjustment expenses. The sum of the current accident year row ties to net losses and loss adjustment expenses disclosed in the Consolidated Statements of Income and Comprehensive Income (Loss). The second loss development table within each underwriting division section presents cumulative net losses and loss adjustment expenses that have been paid to date. The difference between cumulative net losses and loss adjustment expenses in the first table and cumulative net losses and loss adjustment expenses paid to date represent the Company’s net reserves for unpaid losses and loss adjustment expenses. Note 6 c) reconciles net reserves for unpaid losses and loss adjustment expenses included in these loss development tables to reserves for losses and loss adjustment expenses reported in the Consolidated Balance Sheets.
Casualty
| Net Losses and Loss Adjustment Expenses Incurred | ||||||||||||||||||||||||||||||||||||||
| For the Years Ended December 31, | As of December 31, 2024 | |||||||||||||||||||||||||||||||||||||
| Accident Year | 2021 (Unaudited) | 2022 (Unaudited) | 2023 (Unaudited) | 2024 | IBNR | Cumulative Number of Reported Claims | ||||||||||||||||||||||||||||||||
| ($ in thousands) | ||||||||||||||||||||||||||||||||||||||
| 2021 | $ | $ | $ | $ | $ | |||||||||||||||||||||||||||||||||
| 2022 | ||||||||||||||||||||||||||||||||||||||
| 2023 | ||||||||||||||||||||||||||||||||||||||
| 2024 | ||||||||||||||||||||||||||||||||||||||
Total incurred |
$ |
|
||||||||||||||||||||||||||||||||||||
| Cumulative Net Paid Claims and Claims Adjustment Expenses | ||||||||||||||||||||||||||
| For the Years Ended December 31, | ||||||||||||||||||||||||||
| Accident Year | 2021 (Unaudited) | 2022 (Unaudited) | 2023 (Unaudited) |
2024 | ||||||||||||||||||||||
| ($ in thousands) | ||||||||||||||||||||||||||
| 2021 | $ | $ | $ | $ | ||||||||||||||||||||||
| 2022 | ||||||||||||||||||||||||||
| 2023 | ||||||||||||||||||||||||||
| 2024 | ||||||||||||||||||||||||||
Total paid |
$ |
|
||||||||||||||||||||||||
Net reserves for unpaid losses and loss adjustment expenses |
$ |
|
||||||||||||||||||||||||
| Average Annual Percentage Payout of Net Losses and Loss Adjustment Expenses Incurred by Age (Unaudited) | ||||||||||||||||||||||||||
| Years | 1 | 2 | 3 | 4 | ||||||||||||||||||||||
| Casualty | ||||||||||||||||||||||||||
93
Professional Liability
| Net Losses and Loss Adjustment Expenses Incurred | ||||||||||||||||||||||||||||||||||||||
| For the Years Ended December 31, | As of December 31, 2024 | |||||||||||||||||||||||||||||||||||||
| Accident Year | 2021 (Unaudited) | 2022 (Unaudited) | 2023 (Unaudited) | 2024 | IBNR | Cumulative Number of Reported Claims | ||||||||||||||||||||||||||||||||
($ in thousands) |
||||||||||||||||||||||||||||||||||||||
| 2021 | $ | $ | $ | $ | $ | |||||||||||||||||||||||||||||||||
| 2022 | ||||||||||||||||||||||||||||||||||||||
| 2023 | ||||||||||||||||||||||||||||||||||||||
| 2024 | ||||||||||||||||||||||||||||||||||||||
Total incurred |
$ |
|
||||||||||||||||||||||||||||||||||||
| Cumulative Net Paid Claims and Claims Adjustment Expenses | ||||||||||||||||||||||||||
| For the Years Ended December 31, | ||||||||||||||||||||||||||
| Accident Year | 2021 (Unaudited) | 2022 (Unaudited) | 2023 (Unaudited) | 2024 | ||||||||||||||||||||||
| ($ in thousands) | ||||||||||||||||||||||||||
| 2021 | $ | $ | $ | $ | ||||||||||||||||||||||
| 2022 | ||||||||||||||||||||||||||
| 2023 | ||||||||||||||||||||||||||
| 2024 | ||||||||||||||||||||||||||
Total paid |
$ |
|
||||||||||||||||||||||||
Net reserves for unpaid losses and loss adjustment expenses |
$ |
|
||||||||||||||||||||||||
| Average Annual Percentage Payout of Net Losses and Loss Adjustment Expenses Incurred by Age (Unaudited) | ||||||||||||||||||||||||||
| Years | 1 | 2 | 3 | 4 | ||||||||||||||||||||||
| Professional Liability | ||||||||||||||||||||||||||
Healthcare Liability
| Net Losses and Loss Adjustment Expenses Incurred | ||||||||||||||||||||||||||||||||||||||
| For the Years Ended December 31, | As of December 31, 2024 | |||||||||||||||||||||||||||||||||||||
| Accident Year | 2021 (Unaudited) |
2022 (Unaudited) |
2023 (Unaudited) | 2024 | IBNR | Cumulative Number of Reported Claims | ||||||||||||||||||||||||||||||||
($ in thousands) |
||||||||||||||||||||||||||||||||||||||
| 2021 | $ | $ | $ | $ | $ | |||||||||||||||||||||||||||||||||
| 2022 | ||||||||||||||||||||||||||||||||||||||
| 2023 | ||||||||||||||||||||||||||||||||||||||
| 2024 | ||||||||||||||||||||||||||||||||||||||
Total incurred |
$ |
|
||||||||||||||||||||||||||||||||||||
94
| Cumulative Net Paid Claims and Claims Adjustment Expenses | ||||||||||||||||||||||||||
| For the Years Ended December 31, | ||||||||||||||||||||||||||
| Accident Year | 2021 (Unaudited) |
2022 (Unaudited) |
2023 (Unaudited) | 2024 | ||||||||||||||||||||||
($ in thousands) |
||||||||||||||||||||||||||
| 2021 | $ | $ | $ | $ | ||||||||||||||||||||||
| 2022 | ||||||||||||||||||||||||||
| 2023 | ||||||||||||||||||||||||||
| 2024 | ||||||||||||||||||||||||||
Total paid |
$ |
|
||||||||||||||||||||||||
Net reserves for unpaid losses and loss adjustment expenses |
$ |
|
||||||||||||||||||||||||
| Average Annual Percentage Payout of Net Losses and Loss Adjustment Expenses Incurred by Age (Unaudited) | ||||||||||||||||||||||||||
| Years | 1 | 2 | 3 | 4 | ||||||||||||||||||||||
| Healthcare Liability | % | % | % | % | ||||||||||||||||||||||
Baleen Specialty
| Net Losses and Loss Adjustment Expenses Incurred | ||||||||||||||||||||
For the Year Ended December 31, |
As of December 31, 2024 | |||||||||||||||||||
| Accident Year | 2024 | IBNR | Cumulative Number of Reported Claims | |||||||||||||||||
| ($ in thousands) | ||||||||||||||||||||
| 2024 | $ | $ | ||||||||||||||||||
Total incurred |
$ |
|
||||||||||||||||||
| Cumulative Net Paid Claims and Claims Adjustment Expenses | |||||||||||
| Accident Year | For the Years Ended December 31, | ||||||||||
| 2024 | |||||||||||
| 2024 | $ | ||||||||||
Total paid |
$ |
|
|||||||||
Net reserves for unpaid losses and loss adjustment expenses |
$ |
|
|||||||||
| Average Annual Percentage Payout of Net Losses and Loss Adjustment Expenses Incurred by Age | |||||||||||
| Years | 1 | ||||||||||
| Baleen Specialty | % | ||||||||||
95
c)Reconciliation of Net Incurred and Paid Claims Development to Consolidated Balance Sheets
The following table reconciles total reserves for losses and loss adjustment expenses, net of reinsurance, included in the loss development tables to reserves for losses and loss adjustment expenses reported in the Consolidated Balance Sheets at December 31, 2024 and 2023:
| December 31, 2024 | ||||||||||||||||||||
| Line of Business | Net Reserves for Unpaid Losses and Loss Expenses | Reinsurance Recoverable on Unpaid Losses | Gross Reserves for Losses and Loss Expenses | |||||||||||||||||
| ($ in thousands) | ||||||||||||||||||||
| Casualty | $ | $ | $ | |||||||||||||||||
| Professional Liability | ||||||||||||||||||||
| Healthcare Liability | ||||||||||||||||||||
| Baleen Specialty | ||||||||||||||||||||
Total |
$ |
|
$ |
|
$ |
|
||||||||||||||
| December 31, 2023 | ||||||||||||||||||||
| Line of Business | Net Reserves for Unpaid Losses and Loss Expenses | Reinsurance Recoverable on Unpaid Losses | Gross Reserves for Losses and Loss Expenses | |||||||||||||||||
| ($ in thousands) | ||||||||||||||||||||
| Casualty | $ | $ | $ | |||||||||||||||||
| Professional Liability | ||||||||||||||||||||
| Healthcare Liability | ||||||||||||||||||||
| Total | $ |
|
$ |
|
$ |
|
||||||||||||||
7.Premiums and Reinsurance Related Information
The following table summarizes the effects of reinsurance on the Company’s written and earned premiums and losses and loss adjustment expenses:
| Year Ended December 31, 2024 | Written Premiums | Earned Premiums | Losses and Loss Adjustment Expenses | |||||||||||||||||
| ($ in thousands) | ||||||||||||||||||||
| Assumed | $ | $ | $ | |||||||||||||||||
| Ceded | ( |
( |
( |
|||||||||||||||||
Net |
$ |
|
$ |
|
$ |
|
||||||||||||||
| Year Ended December 31, 2023 | Written Premiums | Earned Premiums | Losses and Loss Adjustment Expenses | |||||||||||||||||
| ($ in thousands) | ||||||||||||||||||||
| Assumed | $ | $ | $ | |||||||||||||||||
| Ceded | ( |
( |
( |
|||||||||||||||||
Net |
$ |
|
$ |
|
$ |
|
||||||||||||||
96
| Year Ended December 31, 2022 | Written Premiums | Earned Premiums | Losses and Loss Adjustment Expenses | |||||||||||||||||
| ($ in thousands) | ||||||||||||||||||||
| Assumed | $ | $ | $ | |||||||||||||||||
| Ceded | ( |
( |
( |
|||||||||||||||||
Net |
$ |
|
$ |
|
$ |
|
||||||||||||||
All assumed amounts are assumed through the AmFam Quota Share Agreement as described in Note 12.
For the years ended December 31, 2024, 2023 and 2022 Bowhead ceded $28.0 million, $18.0 million and $2.7 million of written premium, $21.7 million, $9.0 million and $1.1 million of earned premium and $13.5 million, $5.3 million and $0.6 million of losses and loss adjustment expenses to a subsidiary of AmFam, respectively.
The following table summarizes reinsurance recoverable on paid and unpaid losses and loss adjustment expenses:
| As of December 31, | 2024 | 2023 | ||||||||||||
| ($ in thousands) | ||||||||||||||
| Reinsurance recoverable on unpaid losses and loss adjustment expenses | $ | $ | ||||||||||||
| Reinsurance recoverable on paid losses and loss adjustment expenses | ||||||||||||||
Reinsurance recoverable |
$ |
|
$ |
|
||||||||||
The following table summarizes the Company’s top five reinsurers, their A.M. Best financial strength rating and percent of total reinsurance recoverable as of December 31, 2024 and 2023:
| Reinsurer | A.M. Best Rating | 2024 | 2023 | |||||||||||||||||
| Renaissance Reinsurance U.S. Inc | A+ | |||||||||||||||||||
| Endurance Assurance Corporation | A+ | |||||||||||||||||||
| Markel Global Reinsurance Company | A | |||||||||||||||||||
| Ascot Bermuda Limited | A | |||||||||||||||||||
| American Family Connect Property and Casualty Insurance Company | A | |||||||||||||||||||
| Partner Reinsurance Company of the U.S. | A+ | |||||||||||||||||||
| All other reinsurers | At least A | |||||||||||||||||||
| Total | ||||||||||||||||||||
For the years ended December 31, 2024 and 2023, $19.2 million and $5.9 million, respectively, of the Company’s reinsurance recoverable balance is with a subsidiary of AmFam.
8.Revolving Credit
On April 22, 2024, the Company entered into a Credit Agreement (the “Credit Agreement”) with certain lenders and JPMorgan Chase Bank, N.A., as administrative agent, swingline lender and issuing bank. The Credit Agreement provides for a senior secured revolving credit facility (the “Facility”) in the aggregate principal amount of $75 million, which includes a $5 million sub-facility for letters of credit. All obligations under the Facility and obligations in respect of certain cash management services and swap agreements with the lenders and their affiliates are (i) unconditionally guaranteed by certain of the Company’s subsidiaries and (ii) secured by a first-priority perfected lien in substantially all of the Company’s and the subsidiaries guarantors’ assets. The Credit Agreement contains certain customary covenants, including financial maintenance covenants. The Company was in compliance with all of the Facility’s covenants as of December 31, 2024. The Facility matures on the earlier of April 22, 2027, or 91 days prior to the MGA Agreement termination date where no MGA Agreement replacement is found. The Company may request that the lenders extend the maturity date by an additional year, provided that the request is
97
made no earlier than 90 days and no later than 55 days prior to the first or second anniversary of the effective date of the Facility.
Interest on the Facility is based on a floating rate indexed to either (i) adjusted term Secured Overnight Financing Rate (“SOFR”) plus an applicable rate, (ii) the greater of (a) the prime rate, (b) the Federal Reserve Bank of New York rate plus 0.5 % per annum and (c) the adjusted term SOFR rate for a one-month interest period plus 1 % per annum, plus an applicable rate, or (iii) the adjusted daily simple SOFR plus an applicable rate. As of December 31, 2024, the Company did not have any borrowings outstanding under the Facility.
The Company had unamortized deferred financing fees related to the Facility of $1.4 million as of December 31, 2024, and recognized amortization expenses for deferred financing fees of $0.7 million for the year ended December 31, 2024.
9.Stockholders’ Equity
Capital Stock
The Company’s authorized capital stock consists of 400,000,000 shares of common stock, par value $0.01 per share and 100,000,000 shares of preferred stock, par value $0.01 per share.
BIHL Contribution
During the years ended December 31, 2024, 2023 and 2022, BIHL contributed additional paid-in capital of $4.5 million, $77.7 million, and $24.0 million, respectively, to the Company without issuing additional shares. In 2022, upon the determination that the Company’s capital was in excess of Wisconsin regulatory capital requirements, the Company returned $25.0 million of capital to BIHL.
Public Offerings
On May 23, 2024, the Company completed an upsized IPO with the sale and issuance of 8,658,823 shares of its common stock at a price of $17.00 per share. The Company received net proceeds from the offering of $131.0 million.
10.Stock-Based Compensation
Class P Interests
On October 14, 2020, BIHL established and authorized for issuance 40,750,000 Class P Interests for certain key employees of the Company. In December 2023 and January 2024, BIHL authorized for issuance an additional 4,766,315 and 553,048 Class P Interests, respectively, for a total of 46,069,363 Class P Interests authorized for issuance. Each grant is subject to vesting and repurchase provisions, as well as other conditions.
Each Class P Interest is structured as a profit interest award and entitles the employees to profits after the partners of BIHL receive a return of their initial investments. Pursuant to the BIHL Partnership Agreement, since the Company is a wholly-owned subsidiary of BIHL, the profits of the Company ultimately flow through to BIHL. The Class P Interests are entitled to receive distributions upon BIHL meeting certain performance and market-based conditions over a five-year period. The general partners of BIHL can determine if distributions will be made in the form of assets, including shares of the Company, common stock held by BIHL, or cash. The Class P Interests vest using a graded method over five years commencing on the date of grant.
98
On June 30, 2024, in preparation for the dissolution of BIHL, the general partner of BIHL approved the valuation and the acceleration of unvested Class P Interests, which prior to the dissolution of BIHL are exchanged for shares of the Company’s common stock held by BIHL with no further vesting conditions. Accordingly, on June 30, 2024, the Company accelerated the remaining unrecognized compensation cost associated with the Class P Interests of $1.3 million through operating expenses within the Company’s Consolidated Statements of Income and Comprehensive Income (Loss). On September 9, 2024, in contemplation of the dissolution of BIHL, the general partner of BIHL approved the full vesting of unvested Class P Interests, and the holders of outstanding Class P Interests subsequently received a distribution of shares of the Company’s common stock held by BIHL with no further vesting conditions. See Note 1 for additional information on the dissolution of BIHL.
The following is a summary of activity related to the unvested Class P Interests:
| 2024 | |||||||||||
| Units | Weighted Average Grant Date Fair Value | ||||||||||
| Granted and unvested at December 31, 2023 | $ | ||||||||||
| Granted | |||||||||||
| Vested | ( |
( |
|||||||||
| Forfeited | |||||||||||
| Granted and unvested at December 31, 2024 |
|
$ | |||||||||
The Company estimates the fair value of the Class P Interest using a Monte Carlo simulation method, which calculates many potential outcomes for an award and determines fair value based on the most likely outcome.
As of December 31, 2024, 2023 and 2022, total unrecognized compensation expense was nil , $1.5 million and $0.9 million, respectively, and the weighted average period over which the expense is expected to be recognized is approximately nil, 1.9 and 1.5 years, respectively.
2024 Plan
On May 22, 2024, the Board approved and adopted the 2024 Plan, which provides for the grant of stock options (including ISOs and nonqualified stock options), stock appreciation rights, restricted stock, RSUs, other stock-based awards, stock bonuses, cash awards and substitute awards.
A total of 3,152,941 shares of common stock were initially authorized and reserved for issuance under the 2024 Plan. The reserve increases on January 1 of each year, starting in 2025, by an amount equal to the lesser of: (a) 2.0 % of the fully-diluted shares on the preceding December 31, and (b) a smaller amount as determined by the Board.
On May 22, 2024, the Board approved the grant of RSUs to the Company’s employees and certain Board directors, and PSUs to its CEO. As of December 31, 2024, 892,826 shares of common stock were granted under the 2024 Plan.
Restricted Stock Units
On May 22, 2024, the Board approved the grant of 762,115 RSUs with a grant-date fair value of $17.00 per share. Additional RSUs were granted after May 22, 2024 based on the grant-date fair value of Bowhead’s common stock. The RSUs issued to employees and a one-time issuance to one of the Company’s directors have a four-year vesting period. These RSUs vest 20 % per year for the first three years following issuance and 40 % at the end of the fourth year, and are contingent upon the employee’s continuous employment or the director’s continuous service as a director with the Company throughout the vesting period. In addition, the RSUs issued to directors of the Company under the Company’s non-employee director compensation policy are contingent upon the director’s continuous service as a director through the vesting date, which is the earliest of: (a) the one-year anniversary of the grant date, (b) the date of the regular annual meeting of the Company’s stockholders held following the grant date, or (c) the date of the consummation of a change in control.
99
The following table provides a summary of RSU activities during the year ended December 31, 2024:
Number of RSUs |
Weighted Average Grant-Date Fair Value | ||||||||||
| Granted and unvested at December 31, 2023 | $ | ||||||||||
Granted |
|||||||||||
Vested |
( |
||||||||||
Forfeited |
( |
||||||||||
| Granted and unvested at December 31, 2024 |
|
$ |
|
||||||||
The Company recognizes the compensation cost for the RSUs on a straight-line basis over the awards’ vesting period.
The Company recognized compensation costs associated with the RSUs of $2.3 million, for the year ended December 31, 2024. Since the RSUs were authorized for issuance in 2024, there were no
As of December 31, 2024, total unrecognized compensation cost for the RSUs were $10.9 million, and the weighted average period over which the cost is expected to be recognized is approximately 3.3 years.
Performance Stock Units
On May 22, 2024, the Board approved the grant of 129,411 PSUs to the Company’s CEO. The grant-date fair value of the PSUs, which was valued based on a Monte Carlo simulation model, was 10.04 per share. The PSUs include both a service and a market condition, and may be settled in cash upon the occurrence of an event that is outside of the Company’s control. The vesting of the PSUs are contingent upon the CEO’s continuous employment and service to the Company through May 22, 2027. The number of PSUs earned, which range from 0 - 125 % of the PSUs granted, are based on the achievement of certain compounded annual growth rate milestones of BSHI’s common stock compared its IPO price of $17.00 per share for any 20 business day period between the second and third anniversaries of the grant date.
Since the PSUs are required to be settled in cash upon the occurrence of an event that is outside of the Company’s control, the PSUs are accounted for as mezzanine equity on the Company’s Consolidated Balance Sheets until the vesting date.
The following table provides a summary of PSU activity during the year ended December 31, 2024:
Number of PSUs |
Weighted Average Grant-Date Fair Value | ||||||||||
| Granted and unvested at December 31, 2023 | $ | ||||||||||
Granted |
|||||||||||
Vested |
|||||||||||
Forfeited |
|||||||||||
| Granted and unvested at December 31, 2024 |
|
$ |
|
||||||||
100
The following table summarizes the significant inputs used in the Monte Carlo simulation model to determine the grant-date fair value of the PSUs awarded:
| Inputs | ||||||||
| Expected term (in years) | ||||||||
Expected volatility |
||||||||
Expected dividend yield |
||||||||
| Risk-free interest rate | ||||||||
The Company recognizes the compensation cost for PSUs on a straight-line basis over the award’s vesting period.
The Company recognized compensation costs associated with the PSUs of $0.3 million in the year ended December 31, 2024. Since the PSUs were authorized for issuance in 2024, there were no
As of December 31, 2024, total unrecognized compensation cost for the PSUs was $1.0 million and the weighted average period over which the cost is expected to be recognized is approximately 2.4 years.
Warrants
On May 22, 2024, the Board approved the issuance of warrants to AmFam to purchase 1,614,250 shares of the Company’s common stock (the warrants associated with such shares the “Initial Warrants”) and, upon the exercise of the underwriters overallotment option, on May 28, 2024, the Company issued to AmFam warrants to purchase 56,471 additional shares of the Company’s common stock (the warrants associated with such additional shares, individually, the “Overallotment Warrants” and together with the Initial Warrants, the “Warrants”).
The Warrants, which are subject to a five-year service condition, are accounted for as stock-based compensation under ASC 718. The grant-date fair value of the Initial Warrants and Overallotment Warrants were $9.13 per share and $17.50 per share, respectively. The Warrants vest 20 % per year over the five-year service period and have a stated and weighted average exercise price of $17.00 per share. The vested portion of the Warrants may be exercised at any time, in whole or in part, until the ten-year anniversary of the issuance dates.
As of December 31, 2024, none of the Warrants have vested or have been exercised.
The following table summarizes the significant inputs used in the Black-Scholes-Merton pricing models to determine the grant-date fair value of the Warrants issued:
| Initial Warrants | Overallotment Warrants | ||||||||||
| Expected term (in years) | |||||||||||
| Expected volatility | |||||||||||
| Expected dividend yield | |||||||||||
| Risk-free interest rate | |||||||||||
The Company recognizes compensation cost for the Warrants on a quarterly basis over the awards’ vesting period.
The Company recognized compensation costs associated with the Warrants of $1.9 million in the year ended December 31, 2024. Since the Warrants were authorized for issuance in 2024, there were no 13.8 million.
101
11.Earnings Per Share
The following table provides the calculation of basic and diluted earnings per share:
| Years Ended December 31, | 2024 | 2023 | 2022 | |||||||||||||||||
| ($ in thousands, except share and per share data) | ||||||||||||||||||||
| Numerator | ||||||||||||||||||||
| Net income | $ | $ | $ | |||||||||||||||||
| Denominator | ||||||||||||||||||||
| Basic weighted average shares outstanding | ||||||||||||||||||||
Effect of dilutive awards(1)
|
||||||||||||||||||||
| Restricted stock units | ||||||||||||||||||||
| Performance stock units | ||||||||||||||||||||
| Warrants | ||||||||||||||||||||
Diluted weighted average shares outstanding |
|
|
|
|||||||||||||||||
| Earnings per share | ||||||||||||||||||||
| Basic | $ |
|
$ |
|
$ |
|
||||||||||||||
| Diluted | $ |
|
$ |
|
$ |
|
||||||||||||||
(1) As of December 31, 2024, 2023 and 2022, there were nil
12.Related Party Transactions
Prior to the IPO, BSHI received capital contributions from BIHL up to the amount committed by BIHL’s limited partners, Gallatin Point, AMFIC, members of Bowhead’s management and other minority investors. Effective December 3, 2024, BIHL was dissolved. See Note 1 for additional information on the dissolution of BIHL. As of December 31, 2024, BIHL contributed $183.3 million into the Company, of which $4.5 million, $77.7 million and $24.0 million were contributed in 2024, 2023 and 2022, respectively.
BICI is party to the AmFam Quota Share Agreement, which has been effective since 2020. Under the quota share agreement, BICI assumes 100 % of all Casualty, Professional Liability, Healthcare Liability, and Baleen Specialty risks, net of inuring third-party reinsurance, written on behalf of AmFam by BSUI. AmFam receives a Ceding Fee on net premiums assumed by BICI. BICI is required to set aside assets in a trust to secure a portion of its reinsurance recoverable obligation under the agreement.
Under the MGA Agreements, BSUI is permitted to issue insurance policies on behalf of the AmFam Issuing Carriers and is also responsible for providing accounting, claims handling and other necessary services to the AmFam Issuing Carriers to support its respective regulatory, statutory and other compliance requirements. BSUI is entitled to commission in exchange for these services, which is adjusted to equal actual costs for each month in accordance with the terms of the MGA Agreements.
In 2024, 2023 and 2022, BICI entered into a ceded quota share reinsurance treaty and a ceded excess of loss reinsurance agreement with reinsurers, in which a separate subsidiary of AmFam participated. In addition, BICI also entered into ceded cyber professional lines quota share reinsurance treaties with reinsurers, in which a subsidiary of AmFam also participated.
For the years ended December 31, 2024, 2023 and 2022 Bowhead incurred $8.6 million, $5.8 million and $4.0 million of Ceding Fees under the AmFam Quota Share Agreement, respectively, and ceded $28.0 million, $18.0 million and $2.7 million of written premiums to AmFam under the ceded reinsurance treaties described above, respectively.
102
13.Income Taxes
The Company accounts for income taxes under the asset and liability method, which requires the recognition of deferred tax assets and deferred tax liabilities for the expected future tax consequences of events that have been included in the financial statements. Deferred tax assets and liabilities are measured using enacted tax rates expected to be applied in the years in which temporary differences are expected to be recovered or settled. The Company reduces deferred tax assets by a valuation allowance to the extent management concludes it is more likely than not that the assets will not be realized.
The Company analyzes its tax filing positions in all of the U.S. federal, state, local and foreign tax jurisdictions where it is required to file income tax returns, as well as for all open tax years in these jurisdictions. The Company evaluates tax positions taken or expected to be taken in the course of preparing an entity’s tax returns to determine whether it is “more-likely-than-not” that each tax position will be sustained by the applicable tax authority. There are no tax positions taken or expected to be taken that would significantly increase or decrease unrecognized tax benefits within the next twelve months. Interest and penalties related to uncertain tax positions are recorded within income tax expense within the Consolidated Statement of Operations and Comprehensive Income (Loss). None of the Company’s federal or state tax income tax returns are currently under examination by the IRS or state authorities.
For the tax years ended December 31, 2024, 2023 and 2022, BSHI, BSUI, BICI and BUSI filed a consolidated federal income tax return.
The income tax provision is as follows:
| Years Ended December 31, | 2024 | 2023 | 2022 | |||||||||||||||||
| ($ in thousands) | ||||||||||||||||||||
| Deferred income tax benefit | ||||||||||||||||||||
| Federal | $ | ( |
$ | ( |
$ | ( |
||||||||||||||
| Total deferred income tax benefit | ( |
( |
( |
|||||||||||||||||
| Current income tax expense | ||||||||||||||||||||
| Federal | ||||||||||||||||||||
| State | ||||||||||||||||||||
| Total current income tax expense | ||||||||||||||||||||
Income tax expense |
$ |
|
$ |
|
$ |
|
||||||||||||||
103
The effective tax rate on income from continuing operations was higher than the prevailing statutory federal income tax rate. Among the most significant book-to-tax adjustments were the following:
| Years Ended December 31, | 2024 | 2023 | 2022 | |||||||||||||||||
| ($ in thousands) | ||||||||||||||||||||
Tax expense (benefit) at statutory tax rate of |
$ | $ | $ | |||||||||||||||||
| Tax effect of significant reconciling items: | ||||||||||||||||||||
| Permanent differences | ||||||||||||||||||||
| State tax, net of federal tax | ||||||||||||||||||||
| Other | ||||||||||||||||||||
| Impact of change in enacted federal tax rate | ||||||||||||||||||||
| Valuation allowance | ||||||||||||||||||||
Income tax expense |
$ |
|
$ |
|
$ |
|
||||||||||||||
Deferred income taxes reflect the net tax effects of temporary differences between the carrying amount of assets and liabilities for financial reporting purposes, and the amount used for income tax purposes. Significant components of the Company’s net deferred income taxes are as follows:
| As of December 31, | 2024 | 2023 | ||||||||||||
| ($ in thousands) | ||||||||||||||
| Deferred tax assets | ||||||||||||||
| Unearned premium disallowance | $ | $ | ||||||||||||
| Reserves for losses and loss adjustment expenses | ||||||||||||||
| Unrealized losses on investments | ||||||||||||||
| Share-based compensation | ||||||||||||||
| Amortization of startup costs | ||||||||||||||
| Depreciable assets | ||||||||||||||
| Accrued benefits | ||||||||||||||
| Accrued expenses | ||||||||||||||
| Other | ||||||||||||||
| Capital loss carryforward | ||||||||||||||
Total deferred tax assets |
|
|
||||||||||||
| Deferred tax liabilities | ||||||||||||||
| Deferred policy acquisition costs | $ | $ | ||||||||||||
| Accrued bond discount | ||||||||||||||
| Unrealized investment gains | ||||||||||||||
| Other | ||||||||||||||
| Depreciation | ||||||||||||||
| Total deferred tax liabilities |
|
|
||||||||||||
Net deferred tax assets |
$ |
|
$ |
|
||||||||||
The Company is required to establish a valuation allowance for any gross deferred tax assets that are unlikely to reduce taxes payable in future years. For tax years 2024 and 2023, the Company has determined no
104
As of December 31, 2024, the Company has zero federal net operating loss carryforwards. As of December 31, 2024, the company has capital loss carryforwards of less than $0.1 million, a portion of which will start to expire in 2026 and zero charitable contribution carryforwards.
As of December 31, 2024 and 2023, no no
14.Commitments and Contingencies
a)Concentrations of Credit Risk
The creditworthiness of a counterparty is evaluated by the Company, taking into account credit ratings assigned by independent agencies. The credit approval process involves an assessment of factors, including, among others, the counterparty, country, and industry credit exposure limits. Collateral may be required, at the discretion of the Company, on certain transactions based on the creditworthiness of the counterparty. The areas where significant concentrations of credit risk may exist include cash and cash equivalents, restricted cash and investments, premium balances receivable, and reinsurance recoverable.
Cash and Cash Equivalents, Restricted Cash and Investments
The Company maintains its cash and cash equivalents and restricted cash with high credit quality financial institutions. Cash deposits are in excess of the Federal Deposit Insurance Corporation (“FDIC”) insured limits. The Company has not experienced any losses in such accounts. The Company believes it is not exposed to any significant credit risk on its cash, cash equivalents and restricted cash.
The Company’s available for sale investment portfolio is managed in accordance with guidelines that have been tailored to meet specific investment strategies, including standards of diversification, which limit the allowable holdings of any single issue. There were no investments, other than cash and cash equivalents and investments in U.S. government and government agency securities, in excess of 10% of the Company’s mezzanine equity and stockholders’ equity at December 31, 2024 and 2023.
Premium Balances Receivable
The Company underwrites a significant amount of its business through brokers and a credit risk exists should any of these brokers be unable to fulfill their contractual obligations relating to the payments of premium balances owed to the Company.
The following table summarizes the brokers that make up more than 10% of the Company’s gross written premium for the years ended December 31, 2024, 2023 and 2022:
| Brokers | 2024 | 2023 | 2022 | |||||||||||||||||
| AmWINS Group, Inc. | ||||||||||||||||||||
| Ryan Specialty Group Holdings, Inc. | ||||||||||||||||||||
| Marsh & McLennan Companies | ||||||||||||||||||||
| CRC Insurance Services, Inc. | ||||||||||||||||||||
For the years ended December 31, 2024, 2023 and 2022, the Company recorded an allowance for uncollectible premiums of nil in each respective period.
105
Reinsurance Recoverable
The Company is exposed to the credit risk associated with reinsurance recoverable to the extent that any of its reinsurers fail to meet their obligations under reinsurance contracts. The Company evaluates the financial condition of its reinsurers on a regular basis and monitors concentrations of credit risk with reinsurers. The Company assesses reinsurers based on the assigned credit and financial strength ratings from internationally recognized rating agencies.
At December 31, 2024 and 2023, 100 29.8 %, 23.8 %, and 20.8 % of the Company’s reinsurance recoverable balance and at December 31, 2023, the three largest balances by reinsurer accounted for 29.8 %, 24.5 % and 24.4 % of the Company’s reinsurance recoverable balance. Refer to Note 7 Premiums and Reinsurance Related Information for further information.
b)Purchase Obligations
The Company has entered into certain agreements within which the Company is committed to purchase services, primarily related to software service contracts. The fixed and determinable portion of such purchase obligations was approximately $1.7
c)Litigation
In the ordinary course of business, the Company is subject to disputes, litigation and arbitration arising from its insurance and reinsurance operations. These matters are generally related to insurance and reinsurance claims and are considered in the establishment of reserves for losses and loss adjustment expenses. In addition, the Company may also become involved in legal actions which seek extra-contractual damages, punitive damages or penalties, including claims alleging bad faith in handling of insurance claims. The Company expects its ultimate liability with respect to such matters will not be material to its financial condition. However, adverse outcomes on such matters are possible, from time to time, and could be material to the Company’s results of operations in any particular financial reporting period.
d)Other
15.Employee Benefit Plan
16.Property and Equipment, net
As of December 31, 2024 and 2023, property and equipment, net consists of:
| As of December 31, | 2024 | 2023 | ||||||||||||
| ($ in thousands) | ||||||||||||||
| Computer software | $ | $ | ||||||||||||
| Leasehold improvements | ||||||||||||||
| Furniture and equipment | ||||||||||||||
Property and equipment, cost |
||||||||||||||
| Accumulated depreciation | ( |
( |
||||||||||||
Property and equipment, net |
$ |
|
$ |
|
||||||||||
106
17.Leases
The Company and its subsidiaries have a right to use two distinct office spaces in New York and Chicago under separate lease agreements. On December 1, 2024, the company exercised its option to extend the Chicago lease, which will expire on August 31, 2028, with a renewal option to extend. The leases are classified as operating leases. The Company was not party to any finance lease arrangements as of and during the years ended December 31, 2024 and 2023. The ROU asset and lease liability balances as of December 31, 2024 were $4.0 million and $4.3 million, respectively and the ROU asset and lease liability balances as of December 31, 2023 were $0.5 million and $0.7 million, respectively.
The terms of the operating leases range from to four years , from the dates the Company gained access to the spaces, through to the stated termination dates, which expire in December 2027 and August 2028, respectively. Although each operating lease agreement contains an option to extend the length of the respective lease term, the Company is not reasonably certain it will exercise these options. Due to this uncertainty, in the measurement of the lease liability, the Company has excluded the periods covered by each renewal option from the lease terms.
The Chicago operating lease agreement contains rent escalation features that are reflected in the Company’s lease liability balances. Since the discount rates implicit in the leases are not readily available, the Company used an incremental borrowing rate to discount the remaining lease payments in measuring our lease liability. The Company also did not incur any initial direct costs or make prepayments in connection with these lease arrangements; as such, these amounts are not reflected in the ROU asset.
Lease expense for the years ended December 31, 2024, 2023 and 2022 was $1.2 million, $0.6 million and $0.6 million, respectively. Lease expense is recognized on a straight-line basis over the lease term in operating expenses within the Consolidated Statements of Income and Comprehensive Income (Loss). The Company has immaterial variable lease costs and no short-term leases for the year ended The following table summarizes the Company’s future minimum lease payment obligations under non-cancelable operating leases as of December 31, 2024:
| As of December 31, | 2024 | |||||||
| ($ in thousands) | ||||||||
| Contractual maturities: | ||||||||
| 2025 | ||||||||
| 2026 | ||||||||
| 2027 | ||||||||
| 2028 | ||||||||
| Later years | ||||||||
Total undiscounted future minimum lease payments |
||||||||
| Less: Discount impact | ( |
|||||||
Total discounted operating lease liability |
$ |
|
||||||
The weighted average remaining lease term and weighted average discount rate for the Company’s operating leases as of December 31, 2024 were 3.1 years and 5.0 %, respectively.
107
18.Segment, Geographic, and Product Line Information
The Company is a specialty insurance group that generates revenues by underwriting and offering a variety of specialty insurance products to domestic markets through four distinct underwriting divisions. The CODM is the individual responsible for allocating resources to and assessing the financial performance of segments of the entity. The CODM of the Company, the Chief Executive Officer, assesses the financial health and performance of the Company and makes resource allocation decisions on a consolidated basis; accordingly, the Company has a single operating and reportable segment.
The accounting policies of the segment are the same as those described in the summary of significant accounting policies. The CODM assesses performance for the segment and decides how to allocate resources based on net income that is also reported on the Consolidated Statements of Income and Comprehensive Income (Loss) as consolidated net income. The measure of segment assets is reported on the Consolidated Balance Sheets as total consolidated assets. Net income is used to monitor budget versus actual results. The CODM uses net income in competitive analysis by benchmarking to the Company’s competitors. The competitive analysis along with the monitoring of budgeted versus actual results are used in assessing performance of the segment. The CODM uses the same level of detail as presented on the Consolidated Statements of Income and Comprehensive Income (Loss) to evaluate segment revenue, net income, and significant segment expenses.
The following table presents revenues by underwriting division for the years ended December 31, 2024, 2023 and 2022:
| Underwriting Division | 2024 | 2023 | 2022 | |||||||||||||||||
| ($ in thousands) | ||||||||||||||||||||
| Casualty | $ | $ | $ | |||||||||||||||||
| Professional Liability | ||||||||||||||||||||
| Healthcare Liability | ||||||||||||||||||||
| Baleen Specialty | ||||||||||||||||||||
Net written premiums |
$ |
|
$ |
|
$ |
|
||||||||||||||
The Company’s operations and assets are located entirely within the United States, and all of its revenues are attributed to United States-based policyholders. The Company does not have intra-entity sales or transfers.
The Company has no single major customer representing 10% or more of its total revenues during fiscal years 2024, 2023 and 2022.
19. Insurance – Statutory Information
The Company’s insurance company subsidiary, BICI, received its Certificate of Authority from the Wisconsin Office of the Commissioner of Insurance, which authorized BICI to transact business effective December 18, 2020. BICI is restricted by Wisconsin law as to the amount of dividends it can pay without the approval of regulatory authorities. BICI is restricted from paying dividends by the lesser of: (1) 10.0 % of statutory capital and surplus as of the preceding December 31, or; (2) the greater of: (a) statutory net income for the calendar year preceding the date of the dividend distribution, minus realized capital gains for that year, or (b) aggregate of net income for the three calendar years preceding the date of the dividend or distribution, minus realized capital gains for those calendar years and minus dividends paid or credited and distributions made within the first two of the preceding three calendar years. At December 31, 2024, 2023, and 2022 the maximum dividend that BICI could pay without the approval of regulatory authorities was $16.1 million, $2.9 million, and $0.0 million respectively.
108
BICI’s net income and statutory capital and surplus, as determined in accordance with Statutory Accounting Principles (“SAP”) established by the National Association of Insurance Commissioners (“NAIC”), are as follows:
| 2024 | 2023 | 2022 | |||||||||||||||
| ($ in thousands) | |||||||||||||||||
| Net income | $ | $ | $ | ||||||||||||||
| Statutory capital and surplus | |||||||||||||||||
The significant variances between SAP and GAAP are that for statutory purposes acquisition costs are charged to income as incurred, bonds are carried at amortized cost, deferred federal and state income taxes are subject to limitations, and certain assets designated as non-admitted assets are disallowed.
The NAIC has risk-based capital (“RBC”) requirements that require insurance companies to calculate and report information under a risk-based formula, which measures statutory capital and surplus needs based on a regulatory definition of risk in a company’s mix of products and its balance sheet. This guidance is used to calculate two capital measurements: Total Adjusted Capital and RBC Authorized Control Level. Total Adjusted Capital is equal to the Company’s statutory capital and surplus excluding capital and surplus derived from the use of permitted practices that differ from statutory accounting practices. RBC Authorized Control Level is the capital level used by regulatory authorities to determine whether remedial action is required. Generally, no remedial action is required if Total Adjusted Capital is 200 % or more of the RBC Authorized Control Level. As of December 31, 2024 and 2023, BICI’s capital and surplus exceeds its Authorized Control Level.
20. Subsequent Events
Management of BSHI has evaluated all events occurring after December 31, 2024 through the issuance of these consolidated financial statements and determined that there are no events requiring recognition or disclosure.
109
Bowhead Specialty Holdings Inc.
Schedule II — Condensed Financial Information of Registrant
Balance Sheets (Parent Company)
| December 31, | |||||||||||
| 2024 | 2023 | ||||||||||
| ($ in thousands, except share data) | |||||||||||
| Assets | |||||||||||
| Investments | |||||||||||
| Fixed maturity securities, available for sale, at fair value | $ | $ | |||||||||
| Investment in subsidiaries | |||||||||||
Total investments
|
|
|
|||||||||
| Cash and cash equivalents | |||||||||||
| Accrued investment income | |||||||||||
| Deferred tax assets, net | |||||||||||
| Other assets | |||||||||||
Total assets
|
$ |
|
$ |
|
|||||||
| Liabilities | |||||||||||
| Income taxes payable | $ | $ | |||||||||
| Accrued expenses | |||||||||||
| Other liabilities | |||||||||||
Total liabilities
|
|
|
|||||||||
| Commitments and contingencies (Note 14) | |||||||||||
| Mezzanine equity | |||||||||||
| Performance stock units | |||||||||||
| Stockholders' equity | |||||||||||
| Common stock | |||||||||||
($ |
|||||||||||
| Additional paid-in capital | |||||||||||
| Accumulated other comprehensive loss | ( |
( |
|||||||||
| Retained earnings | |||||||||||
| Total stockholders' equity | |||||||||||
Total mezzanine equity and stockholders' equity
|
|
|
|||||||||
Total liabilities, mezzanine equity and stockholders' equity
|
$ |
|
$ |
|
|||||||
110
Bowhead Specialty Holdings Inc.
Schedule II — Condensed Financial Information of Registrant
Statements of Income (Loss) (Parent Company)
| Years Ended December 31, | |||||||||||||||||
| 2024 | 2023 | 2022 | |||||||||||||||
| ($ in thousands, except share and per share data) | |||||||||||||||||
| Revenues | |||||||||||||||||
| Gross written premiums | $ | $ | $ | ||||||||||||||
| Ceded written premiums | |||||||||||||||||
| Net written premiums | |||||||||||||||||
| Change in net unearned premiums | |||||||||||||||||
Net earned premiums
|
|
|
|
||||||||||||||
| Net investment income | |||||||||||||||||
| Net realized investment gains | |||||||||||||||||
| Other insurance-related income | |||||||||||||||||
Total revenues
|
|
|
|
||||||||||||||
| Expenses | |||||||||||||||||
| Net losses and loss adjustment expenses | |||||||||||||||||
| Net acquisition costs | |||||||||||||||||
| Operating expenses | |||||||||||||||||
| Warrant expense | |||||||||||||||||
| Credit facility interest expense and fees | |||||||||||||||||
Total expenses
|
|
|
|
||||||||||||||
Income before income taxes
|
|
|
|
||||||||||||||
| Income tax expense | |||||||||||||||||
Income before net income of subsidiaries
|
( |
|
|
||||||||||||||
| Net income of subsidiaries | |||||||||||||||||
Net income
|
$ |
|
$ |
|
$ |
|
|||||||||||
| Other comprehensive income (loss) | |||||||||||||||||
| Change in unrealized gain (loss) on investments | |||||||||||||||||
Other comprehensive income (loss) before other comprehensive loss of subsidiaries |
|
|
|||||||||||||||
| Other comprehensive income (loss) of subsidiaries | ( |
||||||||||||||||
Total comprehensive income (loss)
|
$ |
|
$ |
|
$ | ( |
|||||||||||
111
Bowhead Specialty Holdings Inc.
Schedule II — Condensed Financial Information of Registrant
Statements of Cash Flows (Parent Company)
| December 31, | |||||||||||||||||
| 2024 | 2023 | 2022 | |||||||||||||||
($ in thousands) |
|||||||||||||||||
| Cash flows from operating activities: | |||||||||||||||||
| Net income | $ | $ | $ | ||||||||||||||
| Adjustments to reconcile net income to net cash provided by operating activities: | |||||||||||||||||
| Amortization of premiums/discounts on fixed maturities | ( |
||||||||||||||||
| Stock-based compensation | |||||||||||||||||
| Deferred income taxes | ( |
||||||||||||||||
| Warrant expense | |||||||||||||||||
| Net changes in operating assets and liabilities: | |||||||||||||||||
| Accrued investment income | ( |
||||||||||||||||
| Other assets | ( |
||||||||||||||||
| Accrued expenses | |||||||||||||||||
| Income taxes payable | |||||||||||||||||
| Other liabilities | |||||||||||||||||
| Equity in net income of subsidiaries | ( |
( |
( |
||||||||||||||
Net cash provided by operating activities
|
|||||||||||||||||
| Cash flows from investing activities: | |||||||||||||||||
| Purchase of: | |||||||||||||||||
| Fixed maturity securities | ( |
||||||||||||||||
| Proceeds from the sale and maturity of: | |||||||||||||||||
| Fixed maturity securities | |||||||||||||||||
| Investment in subsidiaries | ( |
$ | ( |
$ | ( |
||||||||||||
| Distribution from investment in subsidiary | |||||||||||||||||
Net cash used in (provided by) investing activities
|
( |
( |
|||||||||||||||
| Cash flows from financing activities: | |||||||||||||||||
| Contribution from parent | |||||||||||||||||
| Distribution to parent | ( |
||||||||||||||||
| Proceeds from share issuance related to equity awards | |||||||||||||||||
| Proceeds from share initial public offering, net | |||||||||||||||||
Net cash provided by (used in) financing activities
|
( |
||||||||||||||||
| Net change in cash, cash equivalents and restricted cash | $ | $ | |||||||||||||||
| Cash, cash equivalents and restricted cash, beginning of period | |||||||||||||||||
| Cash, cash equivalents and restricted cash, end of period | $ | $ |
|
$ |
|
||||||||||||
| Non-cash investing and financing activities: | |||||||||||||||||
| Deemed contribution related to share-based compensation to investment in subsidiary | ( |
( |
( |
||||||||||||||
| Deemed contribution related to share-based compensation from parent | |||||||||||||||||
| Deemed contribution related to fixed maturity securities to subsidiary | ( |
||||||||||||||||
112
Bowhead Specialty Holdings Inc.
Schedule IV - Reinsurance
| December 31, 2024 | |||||||||||||||||||||||
| Premiums Ceded to Other Companies | Premiums Assumed from Other Companies | Net Amount | Percentage of Amount Assumed to Net | ||||||||||||||||||||
($ in thousands, except percentages) |
|||||||||||||||||||||||
| Casualty | $ | ( |
$ | $ | % | ||||||||||||||||||
| Professional Liability | ( |
$ | % | ||||||||||||||||||||
| Healthcare Liability | ( |
$ | % | ||||||||||||||||||||
| Baleen Specialty | ( |
$ | % | ||||||||||||||||||||
Total |
$ | ( |
$ |
|
$ |
|
|
% | |||||||||||||||
| December 31, 2023 | |||||||||||||||||||||||
| Premiums Ceded to Other Companies | Premiums Assumed from Other Companies | Net Amount | Percentage of Amount Assumed to Net | ||||||||||||||||||||
($ in thousands, except percentages) |
|||||||||||||||||||||||
| Casualty | $ | ( |
$ | $ | % | ||||||||||||||||||
| Professional Liability | ( |
% | |||||||||||||||||||||
| Healthcare Liability | ( |
$ | % | ||||||||||||||||||||
Total |
$ | ( |
$ |
|
$ |
|
|
% | |||||||||||||||
| December 31, 2022 | |||||||||||||||||||||||
| Premiums Ceded to Other Companies | Premiums Assumed from Other Companies | Net Amount | Percentage of Amount Assumed to Net | ||||||||||||||||||||
| ($ in thousands, except percentages) | |||||||||||||||||||||||
| Casualty | $ | ( |
$ | $ | % | ||||||||||||||||||
| Professional Liability | ( |
% | |||||||||||||||||||||
| Healthcare Liability | ( |
$ | % | ||||||||||||||||||||
| Total | $ | ( |
$ |
|
$ |
|
|
% | |||||||||||||||
113
ITEM 9. CHANGES IN AND DISAGREEMENTS WITH ACCOUNTANTS ON ACCOUNTING AND FINANCIAL DISCLOSURES
Not applicable.
ITEM 9A. CONTROLS AND PROCEDURES
Evaluation of disclosure controls and procedures
We maintain disclosure controls and procedures that are designed to ensure that information required to be disclosed in the reports we file under the Exchange Act is recorded, processed, summarized and reported within the time periods specified in the SEC’s rules and forms, and that such information is accumulated and communicated to our management, including our Chief Executive Officer (“CEO”) and Chief Financial Officer (“CFO”), as appropriate, to allow timely decisions regarding required financial disclosure.
The effectiveness of any system of controls and procedures is subject to certain limitations, and, as a result, there can be no assurance that our controls and procedures will detect all errors or fraud. A control system, no matter how well conceived and operated, can provide only reasonable, not absolute, assurance that the objectives of the control system will be attained.
As of the end of the period covered by this Annual Report on Form 10-K, we carried out an evaluation, under the supervision and with the participation of our management, including our CEO and CFO, of the effectiveness of our disclosure controls and procedures, as defined under Rules 13a-15(e) and 15d-15(e) under the Exchange Act. Based upon this evaluation, our CEO and CFO concluded that our disclosure controls and procedures were effective.
Management’s report on internal control over financial reporting
Management is responsible for establishing and maintaining adequate internal control over financial reporting as defined in Rules 13a-15(f) and 15d-15(f) under the Securities Exchange Act of 1934, as amended. Our internal control over financial reporting is designed to provide reasonable assurance regarding the reliability of financial reporting and the preparation of financial statements for external purposes in accordance with U.S. GAAP. Our internal control over financial reporting includes policies and procedures that:
(i) pertain to the maintenance of records that, in reasonable detail, accurately and fairly reflect the transactions and dispositions of our assets;
(ii) provide reasonable assurance that transactions are recorded as necessary to permit the preparation of our financial statements in accordance with U.S. GAAP, and that our receipts and expenditures are being made only in accordance with authorizations of our management and directors; and
(iii) provide reasonable assurance regarding prevention or timely detection of unauthorized acquisition, use or disposition of our assets that could have a material effect on the financial statements.
Because of its inherent limitations, internal control over financial reporting may not prevent or detect misstatements. Also, projections of any evaluation of effectiveness to future periods are subject to the risk that controls may become inadequate because of changes in conditions, or that the degree of compliance with the policies or procedures may deteriorate.
Management assessed the effectiveness of our internal control over financial reporting as of December 31, 2024, using the framework in Internal Control-Integrated Framework (2013) issued by the Committee of Sponsoring Organizations of the Treadway Commission (“COSO”). Based on this assessment, management concluded that our internal control over financial reporting was effective as of December 31, 2024.
Since we are an emerging growth company, this Annual Report on Form 10-K does not include an attestation report of our company’s registered public accounting firm regarding internal control over financial reporting.
114
Changes in internal control over financial reporting
There were no changes in our internal control over financial reporting (as defined in Rules 13a-15(f) and 15d-15(f) under the Exchange Act) during the quarter ended December 31, 2024 that have materially affected, or are reasonably likely to materially affect, our internal control over financial reporting.
ITEM 9B. OTHER INFORMATION
Securities Trading Plans of Directors and Executive Officers
Transactions in our securities by our directors and executive officers are required to be made in accordance with our Insider Trading Policy (the “Insider Trading Policy”), which, among other things, requires that the transactions be in accordance with applicable U.S. federal securities laws that prohibit trading while in possession of material nonpublic information. Rule 10b5-1 under the Exchange Act provides an affirmative defense that enables prearranged transactions in securities in a manner that avoids concerns about initiating transactions at a future date while possibly in possession of material nonpublic information. Our Insider Trading Policy permits our directors and officers to enter into trading plans designed to comply with Rule 10b5-1.
During the fourth quarter of 2024, none of our directors or officers adopted, modified or terminated a Rule 10b5-1 trading plan or adopted terminated
Change in Control Severance Plan
On February 21, 2025, the Board approved and adopted the Bowhead Specialty Holding Inc. Change in Control Severance Plan (the “Severance Plan”), pursuant to which select employees of the Company (including each of its executive officers, but excluding the Chief Executive Officer of the Company), may become eligible to receive the following severance payments and benefits upon a qualifying termination within twenty-four months following the date of a change in control (each of qualifying termination and change in control as defined in the Severance Plan): (i) a cash payment payable in a lump sum equal to the sum of (x) one and one-half times the participant’s base salary and (y) pro-rata target annual bonus, and (ii) an additional cash payment payable in a lump sum equal to the product of twelve multiplied by the cost incurred by the Company for providing group health, dental and vision benefits to the participant and the participant’s eligible dependents in the month immediately prior to the month in which the qualifying termination date occurred.
The provision of payments and benefits described above is conditioned upon the participant’s execution and non-revocation of a release of claims in favor of the Company. The Severance Plan provides that if a participant receives any amount, whether under the Severance Plan or otherwise, that is subject to the excise tax imposed pursuant to Section 4999 of the Internal Revenue Code, the amount of the payments to be made to the participant will be reduced to the extent necessary to avoid imposition of the excise tax, but only if the net amount of the reduced payments exceeds the net amount that the participant would receive following imposition of the excise tax and all income and related taxes.
The foregoing description of the Severance Plan does not purport to be complete and is qualified in the entirety by reference to the Severance Plan, which is filed as Exhibit 10.17 to this Annual Report on Form 10-K and incorporated by reference herein.
ITEM 9C. DISCLOSURE REGARDING FOREIGN JURISDICTIONS THAT PREVENT INSPECTIONS
Not applicable.
115
PART III
ITEM 10. DIRECTORS, EXECUTIVE OFFICERS AND CORPORATE GOVERNANCE
The information required by this item is incorporated by reference to our definitive proxy statement for our 2025 Annual Meeting of Stockholders, which we expect to file with the SEC within 120 days after the end of the fiscal year covered by this Annual Report on Form 10-K (the “Proxy Statement”), including under the captions “Proposal 1 - Election of Directors,” “Information About our Executive Officers” and “General Information About the Board of Directors.”.
We maintain a Code of Business Conduct and Ethics that applies to all our employees, officers, contractors, and directors, including our principal executive officer, principal financial officer, and principal accounting officer, or persons performing similar functions. The full text of our Code of Business Conduct and Ethics is posted on our website at ir.bowheadspecialty.com under “Governance - Governance Documents.” We intend to disclose on our website any future amendments of our Code of Business Conduct and Ethics or waivers that exempt any principal executive officer, principal financial officer, principal accounting officer, persons performing similar functions, or our directors from provisions in the Code of Business Conduct and Ethics.
We have adopted an Insider Trading Policy governing the purchase, sale and other dispositions of our securities by our directors, officers, employees and other individuals associated with us that we believe is reasonably designed to promote compliance with insider trading laws, rules and regulations and listing standards applicable to us. It is also our policy to comply with applicable securities laws when engaging in transactions in our own securities. A copy of our Insider Trading Policy is filed as Exhibit 19.1 to this Annual Report on Form 10-K.
ITEM 11. EXECUTIVE COMPENSATION
The information required by this item is incorporated by reference to our Proxy Statement, including under the captions “Executive Compensation,” “Director Compensation” and “General Information About the Board of Directors.”
ITEM 12. SECURITY OWNERSHIP OF CERTAIN BENEFICIAL OWNER AND MANAGEMENT AND RELATED STOCKHOLDER MATTERS
The information required by this item is incorporated by reference to our Proxy Statement, including under the captions “Equity Compensation Plan Information” and “Principal Stockholders.”
ITEM 13. CERTAIN RELATIONSHIPS AND RELATED TRANSACTIONS, AND DIRECTOR INDEPENDENCE
The information required by this item is incorporated by reference to our Proxy Statement, including under the captions “General Information About the Board of Directors” and “Certain Relationships and Related Person Transactions.”
ITEM 14. PRINCIPAL ACCOUNTING FEES AND SERVICES
Our independent registered public accounting firm is PricewaterhouseCoopers LLP , Chicago, Illinois . Auditor Firm ID: 238
The information required by this item is incorporated by reference to our Proxy Statement, including under the caption “Fees Billed by the Principal Accountant.”
116
PART IV
ITEM 15. EXHIBITS AND FINANCIAL STATEMENT SCHEDULES
(a)Exhibits
| Number | Description | |||||||
| 3.1 | ||||||||
| 3.2 | ||||||||
4.1* |
||||||||
| 4.2 | ||||||||
| 4.3 | ||||||||
| 4.4 | ||||||||
| 4.5 | ||||||||
10.1† |
||||||||
10.2† |
Second Amended and Restated Managing General Agency Agreement, dated as of August 7, 2024, between Homesite Insurance Company of Florida and Bowhead Specialty Underwriters, Inc. (incorporated by reference to Exhibit 10.18 to the Company’s Quarterly Report on Form 10-Q filed with the SEC on August 8, 2024) |
|||||||
10.3† |
||||||||
10.4† |
||||||||
10.5† |
||||||||
10.6+ |
||||||||
10.7+ |
||||||||
10.8*+ |
||||||||
10.9+ |
||||||||
10.10+ |
||||||||
10.11*+ |
||||||||
117
| Number | Description | |||||||
| 10.12 | ||||||||
| 10.13 | ||||||||
| 10.14 | ||||||||
| 10.15 | ||||||||
| 10.16 | ||||||||
10.17*+†
|
||||||||
14.1* |
||||||||
19.1* |
||||||||
| 21.1 | ||||||||
| 23.1 | ||||||||
31.1* |
||||||||
31.2* |
||||||||
32.1* |
||||||||
32.2* |
||||||||
| 97.1 | ||||||||
101* |
Interactive data files (formatted as Inline XBRL) |
|||||||
104* |
Cover Page Interactive Data File (formatted as Inline XBRL and contained in Exhibit 101) |
|||||||
__________________
+ Indicates management contract or compensatory plan.
† Portions of this exhibit have been omitted pursuant to Item 601(b)(2)(ii) or 601(b)(10)(iv) of Regulation S-K, as applicable.
* Filed or furnished herewith.
(b)Financial Statement Schedules
Schedules not listed above have been omitted because the information required to be set forth therein is not applicable or is shown in the financial statements or notes thereto.
ITEM 16. FORM 10-K SUMMARY
Not applicable.
118
SIGNATURES
Pursuant to the requirements of Section 13 or 15(d) of the Securities Exchange Act of 1934, the registrant has duly caused this report to be signed on its behalf by the undersigned, thereunto duly authorized on February 27, 2025.
| BOWHEAD SPECIALTY HOLDINGS INC. | ||||||||
| By: | /s/ Stephen Sills |
|||||||
Name: |
Stephen Sills | |||||||
Title: |
Chief Executive Officer and President |
|||||||
Pursuant to the requirements of the Securities Exchange Act of 1934, this report has been signed below by the following persons on behalf of the registrant and in the capacities and on the dates indicated.
| Signature | Title | Date | ||||||||||||
/s/ Stephen Sills |
Chief Executive Officer, President and Director
(Principal Executive Officer)
|
February 27, 2025 | ||||||||||||
| Stephen Sills | ||||||||||||||
/s/ Brad Mulcahey |
Chief Financial Officer and Treasurer
(Principal Financial Officer)
|
February 27, 2025 | ||||||||||||
| Brad Mulcahey | ||||||||||||||
/s/ Shirley Yap |
Chief Accounting Officer
(Principal Accounting Officer)
|
February 27, 2025 | ||||||||||||
| Shirley Yap | ||||||||||||||
/s/ Matthew Botein |
Chairperson |
February 27, 2025 | ||||||||||||
Matthew Botein |
||||||||||||||
/s/ Tom Baker |
Director | February 27, 2025 | ||||||||||||
| Tom Baker | ||||||||||||||
/s/ Angela Brock-Kyle |
Director | February 27, 2025 | ||||||||||||
Angela Brock-Kyle |
||||||||||||||
/s/ Zhak Cohen |
Director | February 27, 2025 | ||||||||||||
Zhak Cohen |
||||||||||||||
/s/ Fabian J. Fondriest |
Director | February 27, 2025 | ||||||||||||
Fabian J. Fondriest |
||||||||||||||
/s/ David Foy |
Director | February 27, 2025 | ||||||||||||
David Foy |
||||||||||||||
/s/ David Holman |
Director | February 27, 2025 | ||||||||||||
David Holman |
||||||||||||||
/s/ Ava Schnidman |
Director |
February 27, 2025 | ||||||||||||
Ava Schnidman |
||||||||||||||
/s/ Troy Van Beek |
Director | February 27, 2025 | ||||||||||||
Troy Van Beek |
||||||||||||||
119