EX-99.2
Published on May 6, 2025
Investor Presentation May 2025
COLOR PALETTE Text 50 56 62 Title bar/ Bullets 1 23 65 ACCEN TS 1 1 23 65 80 139 252 2 0 148 255 153 212 255 3 234 71 36 247 181 167 4 164 148 31 235 225 149 5 121 26 104 229 135 213 6 83 161 209 186 217 237 Hyperlink 0 148 255 153 212 255 Followed Hyperlink 234 71 36 247 181 167 Line s 50 56 62 Highlights 1 23 65 TABL E 2 Forward Looking Statements This presentation has been prepared by Bowhead Specialty Holdings Inc. (“we,” “us,” “our,” “Bowhead” or the “Company”) on a confidential basis for the exclusive use of the party to whom Bowhead delivers this presentation. This presentation has been prepared by Bowhead for informational purposes only and not for any other purpose. Nothing contained in this presentation is, or should be construed as, a recommendation, promise or representation by the presenter or Bowhead or any officer, director, employee, agent or advisor of Bowhead. This presentation does not purport to be all inclusive or to contain all of the information you may desire. Information provided in this presentation speaks only as of the date hereof. Bowhead assumes no obligation to update any information or statement after the date of this presentation as a result of new information, subsequent events, or any other circumstances. We request that you keep any information at this meeting confidential and that you do not disclose any of the information to any other parties without the Company's prior express written permission. This presentation contains “forward-looking statements” within the meaning of the Private Securities Litigation Reform Act of 1995. All statements other than statements of historical facts contained in this presentation, including statements regarding our future results of operations or financial condition, business strategy and plans, and objectives of management for future operations are forward-looking statements. Some of the forward-looking statements can be identified by the use of terms such as “believes”, “expects”, “may”, “will”, “should”, “could”, “seeks”, “intends”, “plans”, “estimates”, “anticipates” or other comparable terms. However, not all forward-looking statements contain these identifying words. These forward-looking statements include all matters that are not related to present facts or current conditions or that are not historical facts. They appear in a number of places throughout this presentation and include statements regarding our intentions, beliefs or current expectations concerning, among other things, our consolidated results of operations, financial condition, liquidity, prospects and growth strategies and the industries in which we operate, and including, without limitation, statements relating to our future performance. Forward-looking statements are subject to known and unknown risks and uncertainties, many of which are beyond our control. Our actual results may differ materially from those expressed in, or implied by, the forward-looking statements included in this presentation as a result of various factors, including among others, the factors discussed under the heading “Risk Factors” in our Annual Report on Form 10-K for the year ended December 31, 2024, as well as our other filings with the Securities and Exchange Commission. The forward-looking statements made in this presentation relate only to events as of the date on which the statements are made. We undertake no obligation to update any forward-looking statements made in this presentation to reflect events or circumstances after the date of this presentation or to reflect new information or the occurrence of unanticipated events, except as required by law. We may not actually achieve the plans, intentions, or expectations disclosed in our forward-looking statements, and you should not place undue reliance on our forward-looking statements. Unless otherwise indicated, information contained in this presentation concerning our industry and the markets in which we operate, including our general expectations, market position and market opportunity, is based on our management’s estimates and research, as well as industry and general publications and research, surveys and studies conducted by third parties. Industry publications, studies and surveys generally state that they have been obtained from sources believed to be reliable, although they do not guarantee the accuracy or completeness of such information. We believe that the information from these third-party publications, research, surveys and studies included in this presentation is reliable. Management’s estimates are derived from publicly available information, their knowledge of our industry and their assumptions based on such information and knowledge, which we believe to be reasonable. This data involves a number of assumptions and limitations which are necessarily subject to a high degree of uncertainty and risk due to a variety of factors. These and other factors could cause our future performance to differ materially from our assumptions and estimates. 10- This presentation contains references to our trademarks and service marks and to those belonging to other entities. Solely for convenience, trademarks and trade names referred to in this presentation may appear without the ® or TM symbols, but such references are not intended to indicate, in any way, that we will not assert, to the fullest extent under applicable law, our rights or the rights of the applicable licensor to these trademarks and trade names. We do not intend our use or display of other companies’ trade names, trademarks or service marks to imply a relationship with, or endorsement or sponsorship of us by, any other companies. “Non-admitted” or excess and surplus (“E&S”) lines refers to policies generally not subject to regulations governing premium rates or policy language. We also consider insurance written on an admitted basis through either the New York Free Trade Zone or similar commercial deregulation exemptions available in certain jurisdictions, which are free of rate and form restrictions, to be E&S business. This presentation contains certain financial measures that are not presented in accordance with generally accepted accounting principles in the United States (“U.S. GAAP”). Under U.S. securities laws, these measures are called “non-GAAP financial measures.” We use these non-GAAP financial measures when planning, monitoring and evaluating our performance. We believe these non-GAAP financial measures give our management and other users of our financial information useful insight into our underlying business performance. You should not rely on these non-GAAP financial measures as a substitute for any U.S. GAAP financial measure. While we believe that these non-GAAP financial measures are useful in evaluating our business, this information should be considered supplemental in nature and is not meant to be an alternative to our reported results prepared in accordance with U.S. GAAP. In addition, other companies, including companies in our industry, may calculate such measures differently, which reduces their usefulness as comparative measures. For a reconciliation of such non-GAAP financial measures to the most directly comparable U.S. GAAP financial measures, see the Appendix of this presentation.
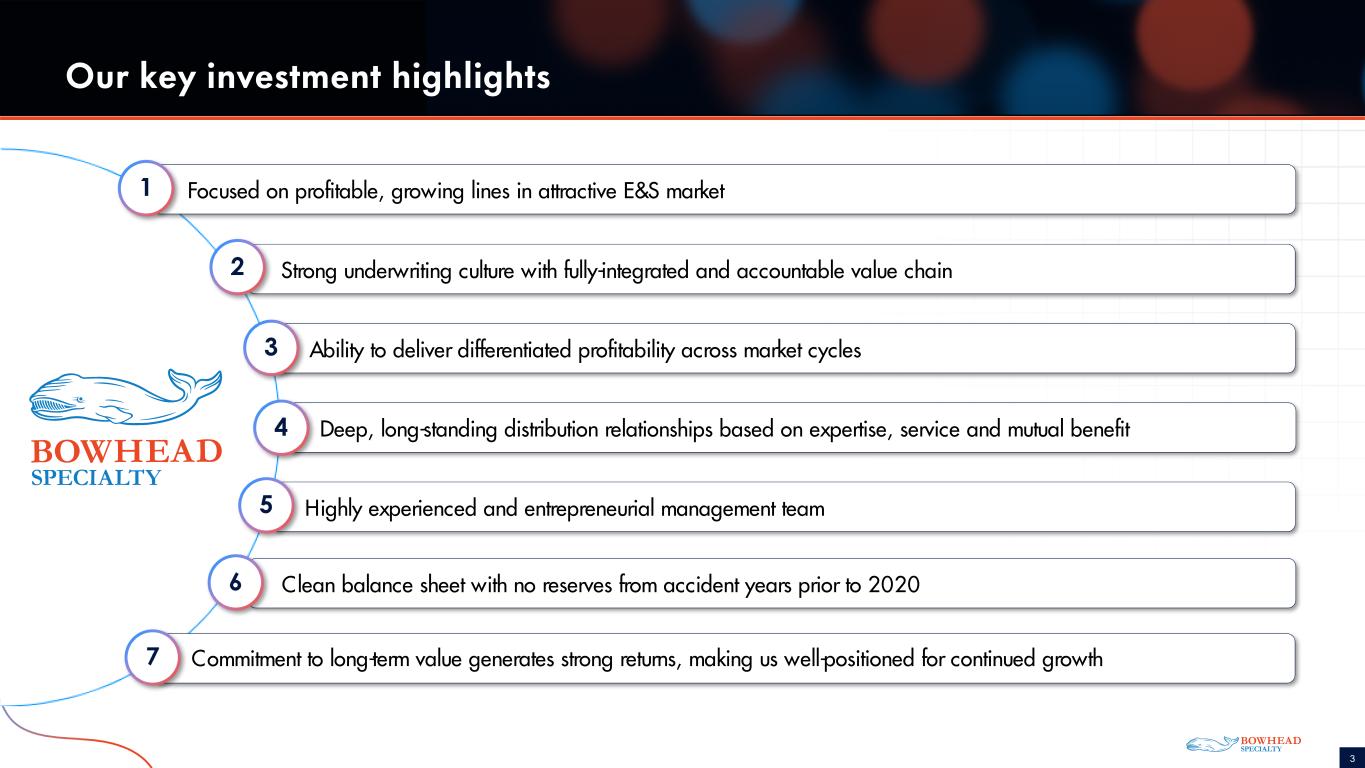
COLOR PALETTE Text 50 56 62 Title bar/ Bullets 1 23 65 ACCEN TS 1 1 23 65 80 139 252 2 0 148 255 153 212 255 3 234 71 36 247 181 167 4 164 148 31 235 225 149 5 121 26 104 229 135 213 6 83 161 209 186 217 237 Hyperlink 0 148 255 153 212 255 Followed Hyperlink 234 71 36 247 181 167 Line s 50 56 62 Highlights 1 23 65 TABL E 3 Our key investment highlights Focused on profitable, growing lines in attractive E&S market Ability to deliver differentiated profitability across market cycles Strong underwriting culture with fully-integrated and accountable value chain Highly experienced and entrepreneurial management team Clean balance sheet with no reserves from accident years prior to 2020 Deep, long-standing distribution relationships based on expertise, service and mutual benefit Commitment to long-term value generates strong returns, making us well-positioned for continued growth
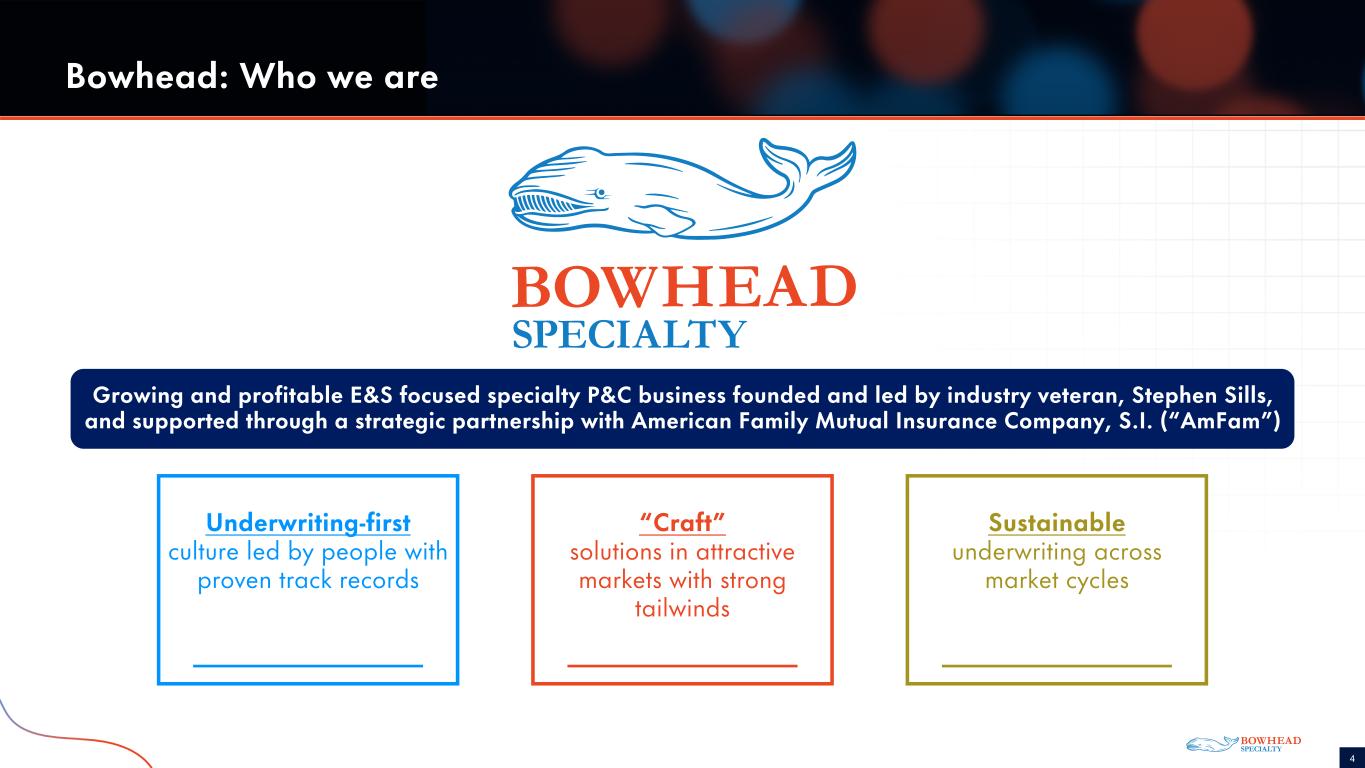
COLOR PALETTE Text 50 56 62 Title bar/ Bullets 1 23 65 ACCEN TS 1 1 23 65 80 139 252 2 0 148 255 153 212 255 3 234 71 36 247 181 167 4 164 148 31 235 225 149 5 121 26 104 229 135 213 6 83 161 209 186 217 237 Hyperlink 0 148 255 153 212 255 Followed Hyperlink 234 71 36 247 181 167 Line s 50 56 62 Highlights 1 23 65 TABL E 4 Bowhead: Who we are Growing and profitable E&S focused specialty P&C business founded and led by industry veteran, Stephen Sills, and supported through a strategic partnership with American Family Mutual Insurance Company, S.I. (“AmFam”) Underwriting-first culture led by people with proven track records “Craft” solutions in attractive markets with strong tailwinds Sustainable underwriting across market cycles
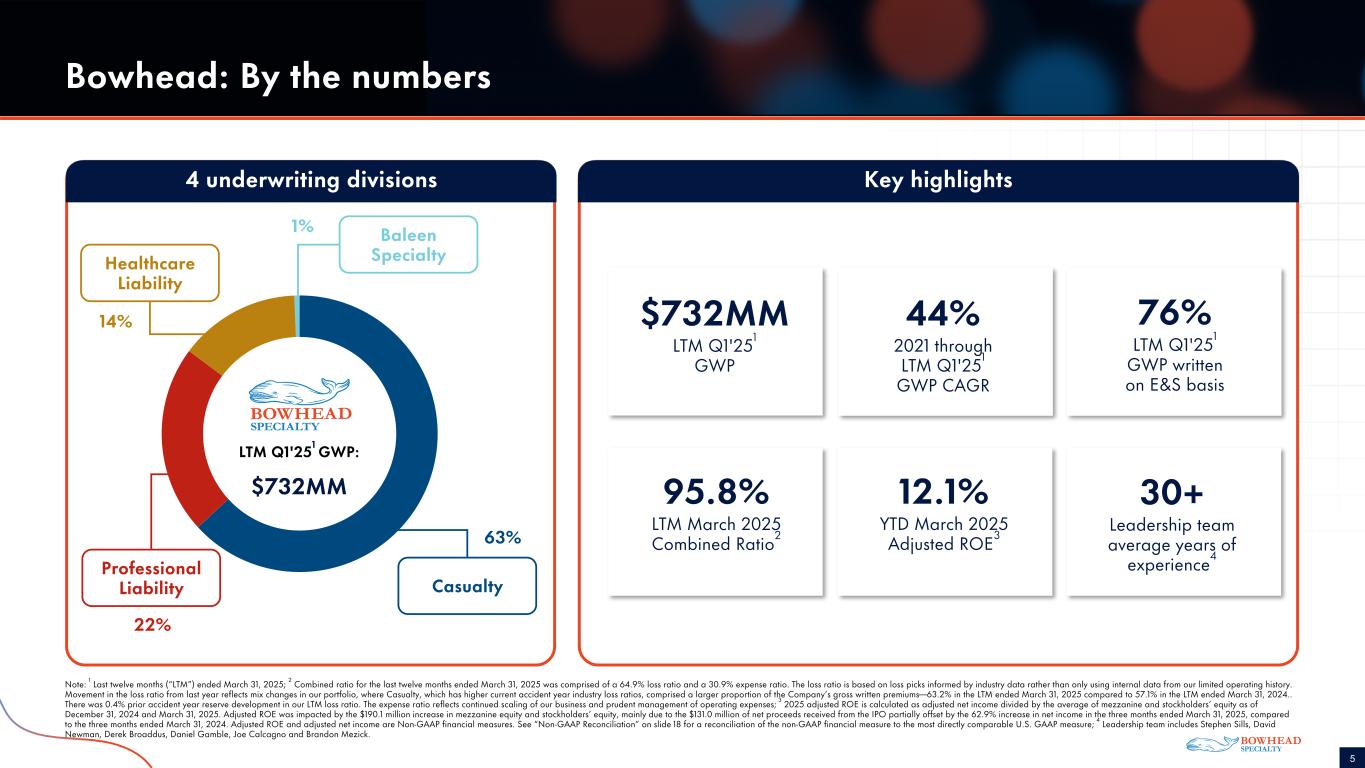
COLOR PALETTE Text 50 56 62 Title bar/ Bullets 1 23 65 ACCEN TS 1 1 23 65 80 139 252 2 0 148 255 153 212 255 3 234 71 36 247 181 167 4 164 148 31 235 225 149 5 121 26 104 229 135 213 6 83 161 209 186 217 237 Hyperlink 0 148 255 153 212 255 Followed Hyperlink 234 71 36 247 181 167 Line s 50 56 62 Highlights 1 23 65 TABL E 5 Note: 1 Last twelve months (“LTM”) ended March 31, 2025; 2 Combined ratio for the last twelve months ended March 31, 2025 was comprised of a 64.9% loss ratio and a 30.9% expense ratio. The loss ratio is based on loss picks informed by industry data rather than only using internal data from our limited operating history. Movement in the loss ratio from last year reflects mix changes in our portfolio, where Casualty, which has higher current accident year industry loss ratios, comprised a larger proportion of the Company’s gross written premiums—63.2% in the LTM ended March 31, 2025 compared to 57.1% in the LTM ended March 31, 2024.. There was 0.4% prior accident year reserve development in our LTM loss ratio. The expense ratio reflects continued scaling of our business and prudent management of operating expenses; 3 2025 adjusted ROE is calculated as adjusted net income divided by the average of mezzanine and stockholders’ equity as of December 31, 2024 and March 31, 2025. Adjusted ROE was impacted by the $190.1 million increase in mezzanine equity and stockholders’ equity, mainly due to the $131.0 million of net proceeds received from the IPO partially offset by the 62.9% increase in net income in the three months ended March 31, 2025, compared to the three months ended March 31, 2024. Adjusted ROE and adjusted net income are Non-GAAP financial measures. See “Non-GAAP Reconciliation” on slide 18 for a reconciliation of the non-GAAP financial measure to the most directly comparable U.S. GAAP measure; 4 Leadership team includes Stephen Sills, David Newman, Derek Broaddus, Daniel Gamble, Joe Calcagno and Brandon Mezick. Bowhead: By the numbers Key highlights4 underwriting divisions LTM Q1'251 GWP: $732MM 63% 22% Professional Liability 14% Casualty Healthcare Liability 95.8% LTM March 2025 Combined Ratio2 12.1% YTD March 2025 Adjusted ROE3 $732MM LTM Q1'251 GWP 76% LTM Q1'251 GWP written on E&S basis 30+ Leadership team average years of experience4 44% 2021 through LTM Q1'251 GWP CAGR 1% Baleen Specialty
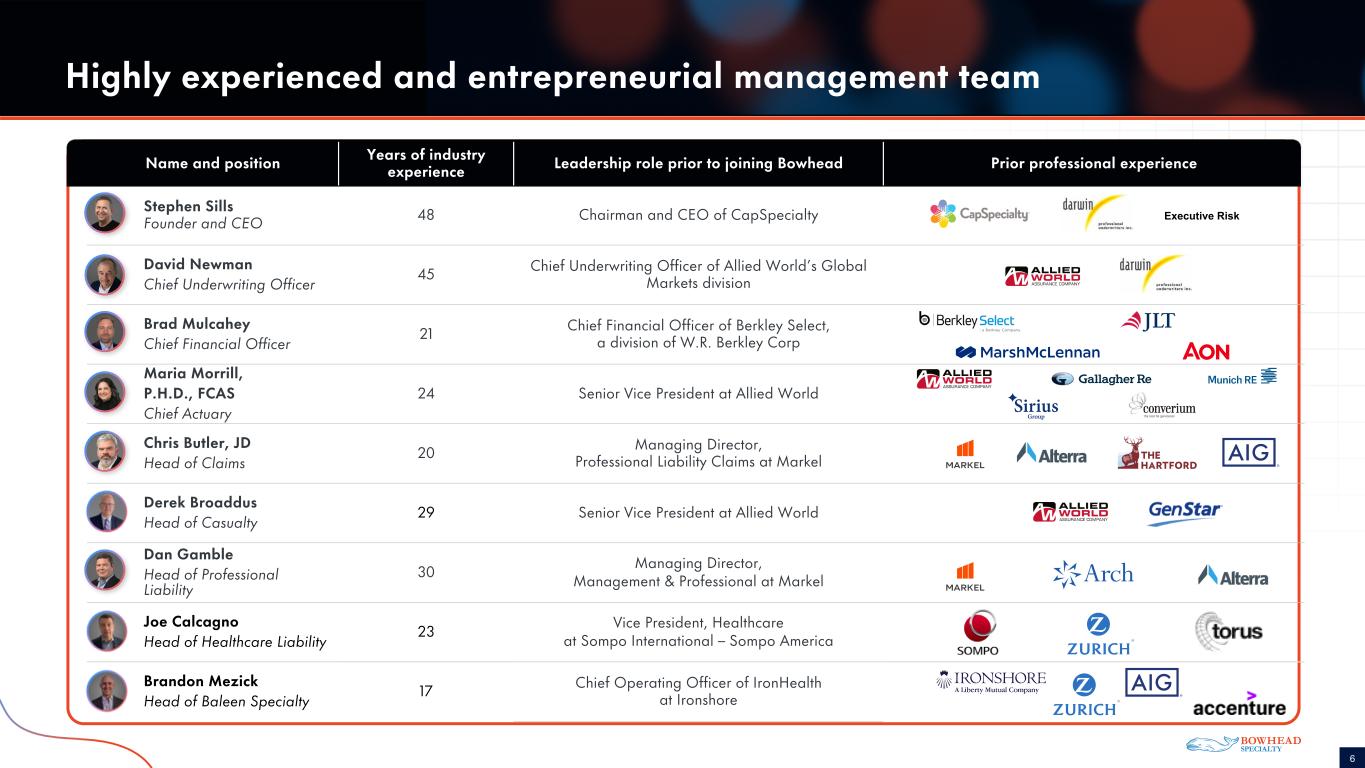
COLOR PALETTE Text 50 56 62 Title bar/ Bullets 1 23 65 ACCEN TS 1 1 23 65 80 139 252 2 0 148 255 153 212 255 3 234 71 36 247 181 167 4 164 148 31 235 225 149 5 121 26 104 229 135 213 6 83 161 209 186 217 237 Hyperlink 0 148 255 153 212 255 Followed Hyperlink 234 71 36 247 181 167 Line s 50 56 62 Highlights 1 23 65 TABL E 6 Highly experienced and entrepreneurial management team Name and position Years of industry experience Leadership role prior to joining Bowhead Prior professional experience Stephen Sills Founder and CEO 48 Chairman and CEO of CapSpecialty David Newman Chief Underwriting Officer 45 Chief Underwriting Officer of Allied World’s Global Markets division Brad Mulcahey Chief Financial Officer 21 Chief Financial Officer of Berkley Select, a division of W.R. Berkley Corp Maria Morrill, P.H.D., FCAS Chief Actuary 24 Senior Vice President at Allied World Chris Butler, JD Head of Claims 20 Managing Director, Professional Liability Claims at Markel Derek Broaddus Head of Casualty 29 Senior Vice President at Allied World Dan Gamble Head of Professional Liability 30 Managing Director, Management & Professional at Markel Joe Calcagno Head of Healthcare Liability 23 Vice President, Healthcare at Sompo International – Sompo America Brandon Mezick Head of Baleen Specialty 17 Chief Operating Officer of IronHealth at Ironshore Executive Risk
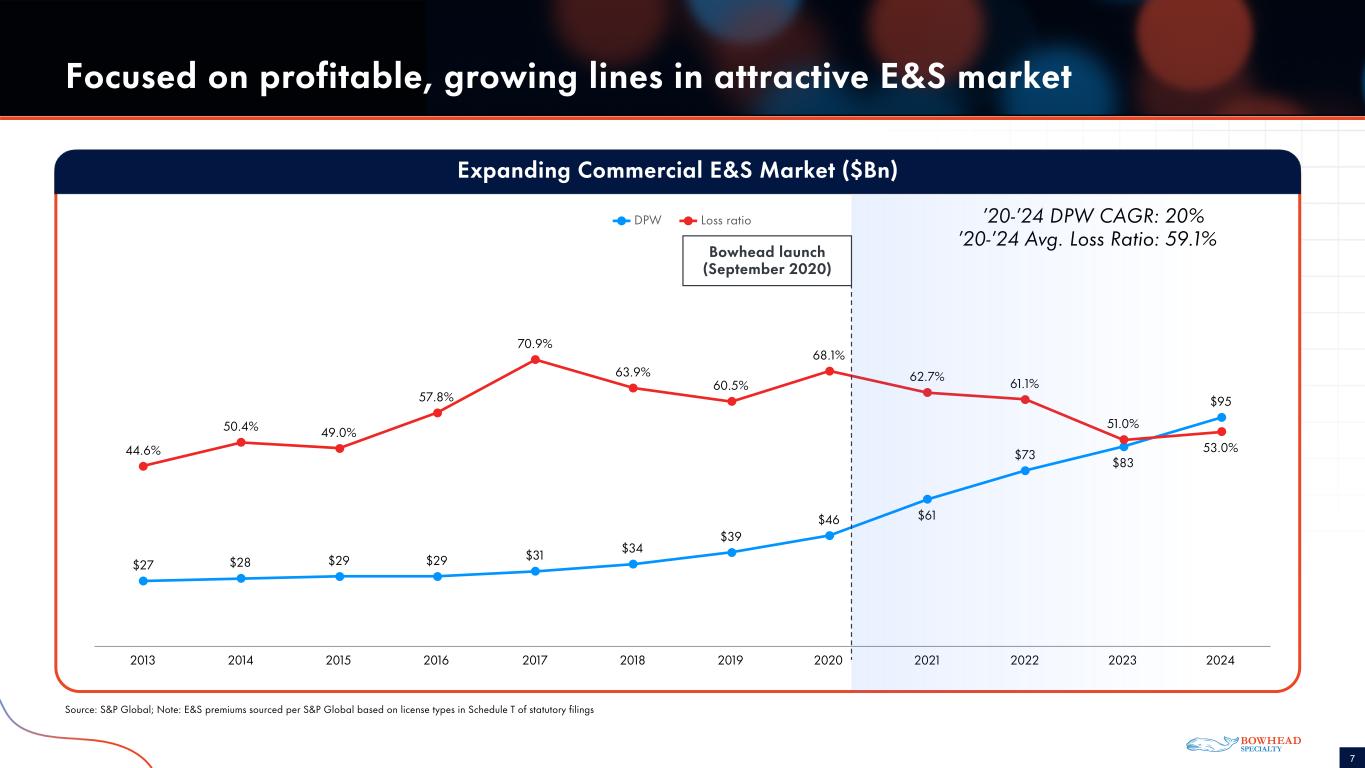
COLOR PALETTE Text 50 56 62 Title bar/ Bullets 1 23 65 ACCEN TS 1 1 23 65 80 139 252 2 0 148 255 153 212 255 3 234 71 36 247 181 167 4 164 148 31 235 225 149 5 121 26 104 229 135 213 6 83 161 209 186 217 237 Hyperlink 0 148 255 153 212 255 Followed Hyperlink 234 71 36 247 181 167 Line s 50 56 62 Highlights 1 23 65 TABL E 7 $27 $28 $29 $29 $31 $34 $39 $46 $61 $73 $83 $95 44.6% 50.4% 49.0% 57.8% 70.9% 63.9% 60.5% 68.1% 62.7% 61.1% 51.0% 53.0% DPW Loss ratio 2013 2014 2015 2016 2017 2018 2019 2020 2021 2022 2023 2024 Focused on profitable, growing lines in attractive E&S market Expanding Commercial E&S Market ($Bn) Bowhead launch (September 2020) Source: S&P Global; Note: E&S premiums sourced per S&P Global based on license types in Schedule T of statutory filings ’20-’24 DPW CAGR: 20% ’20-’24 Avg. Loss Ratio: 59.1%
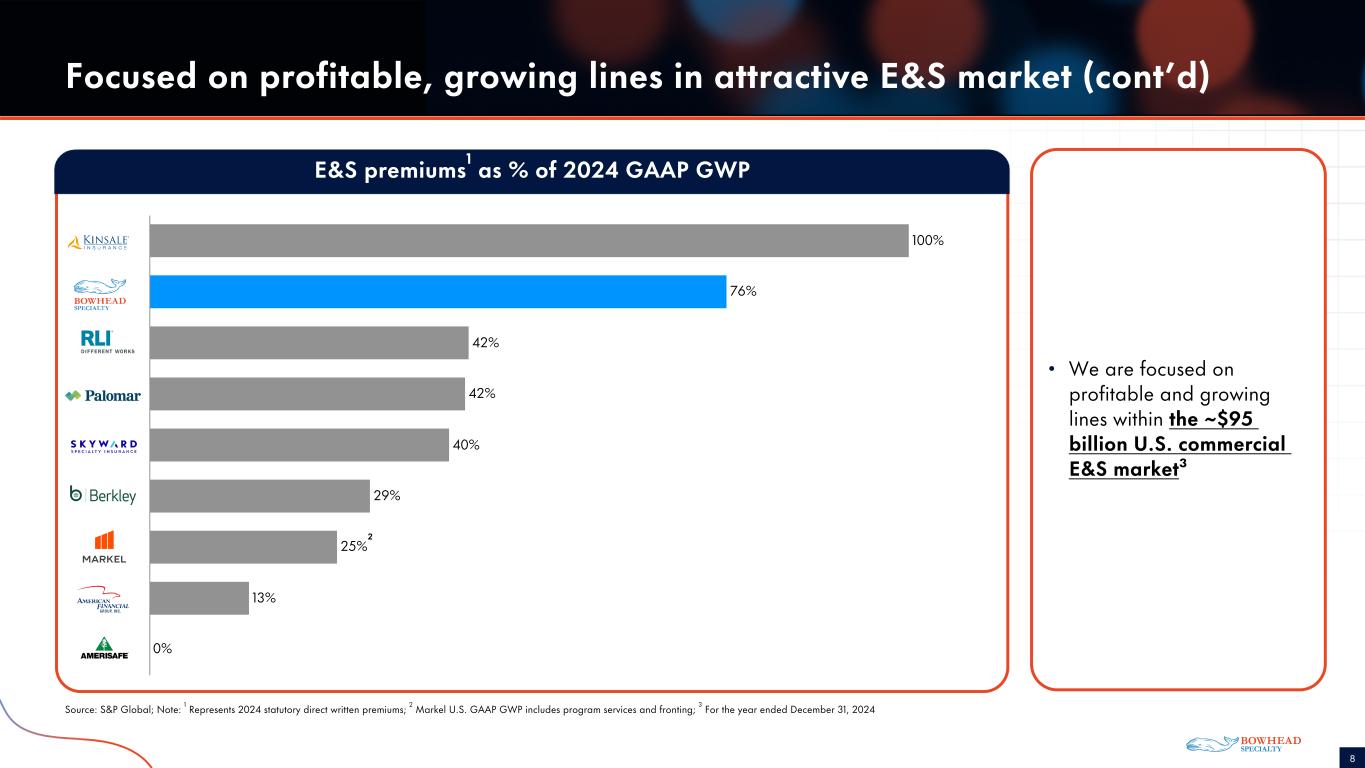
COLOR PALETTE Text 50 56 62 Title bar/ Bullets 1 23 65 ACCEN TS 1 1 23 65 80 139 252 2 0 148 255 153 212 255 3 234 71 36 247 181 167 4 164 148 31 235 225 149 5 121 26 104 229 135 213 6 83 161 209 186 217 237 Hyperlink 0 148 255 153 212 255 Followed Hyperlink 234 71 36 247 181 167 Line s 50 56 62 Highlights 1 23 65 TABL E 8 100% 76% 42% 42% 40% 29% 25% 13% 0% E&S premiums1 as % of 2024 GAAP GWP Focused on profitable, growing lines in attractive E&S market (cont’d) Source: S&P Global; Note: 1 Represents 2024 statutory direct written premiums; 2 Markel U.S. GAAP GWP includes program services and fronting; 3 For the year ended December 31, 2024 • We are focused on profitable and growing lines within the ~$95 billion U.S. commercial E&S market³ 2
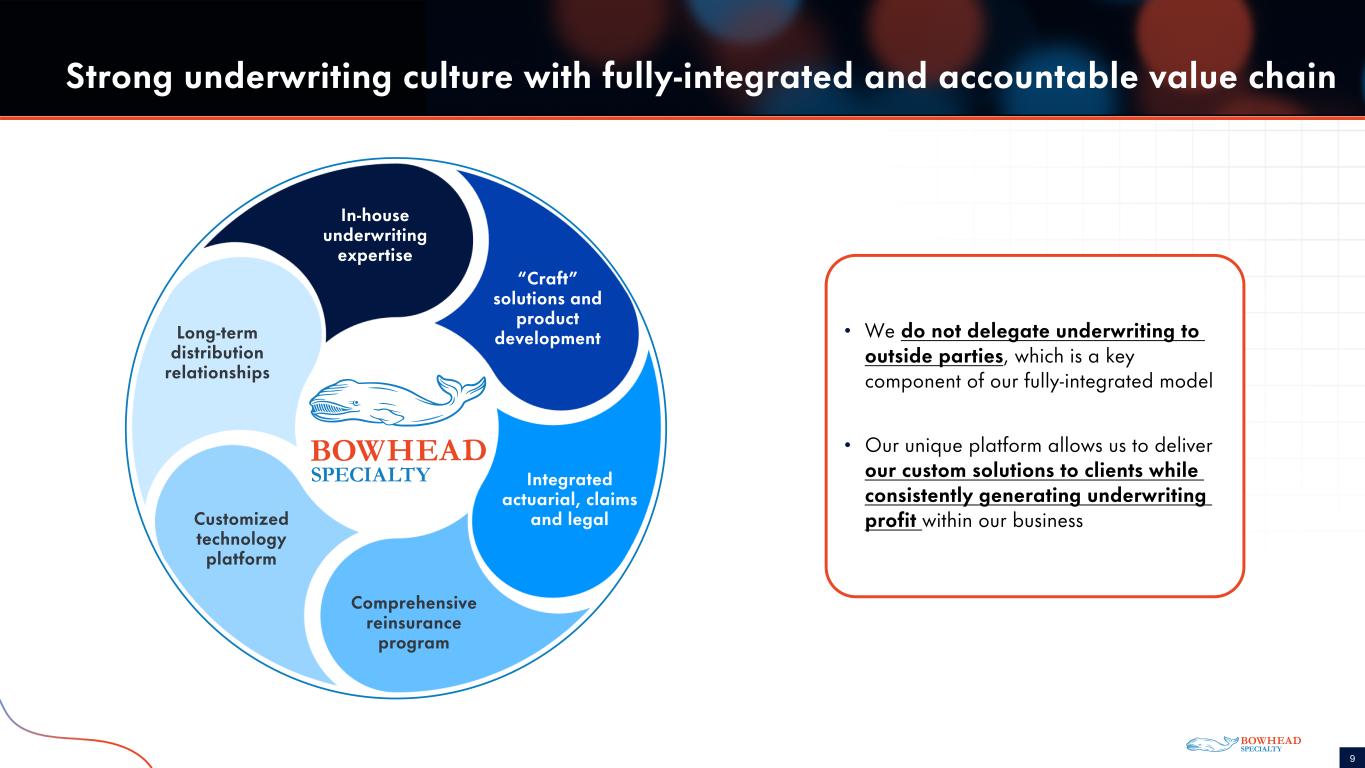
COLOR PALETTE Text 50 56 62 Title bar/ Bullets 1 23 65 ACCEN TS 1 1 23 65 80 139 252 2 0 148 255 153 212 255 3 234 71 36 247 181 167 4 164 148 31 235 225 149 5 121 26 104 229 135 213 6 83 161 209 186 217 237 Hyperlink 0 148 255 153 212 255 Followed Hyperlink 234 71 36 247 181 167 Line s 50 56 62 Highlights 1 23 65 TABL E 9 Strong underwriting culture with fully-integrated and accountable value chain In-house underwriting expertise “Craft” solutions and product development Integrated actuarial, claims and legal Comprehensive reinsurance program Customized technology platform Long-term distribution relationships • We do not delegate underwriting to outside parties, which is a key component of our fully-integrated model • Our unique platform allows us to deliver our custom solutions to clients while consistently generating underwriting profit within our business
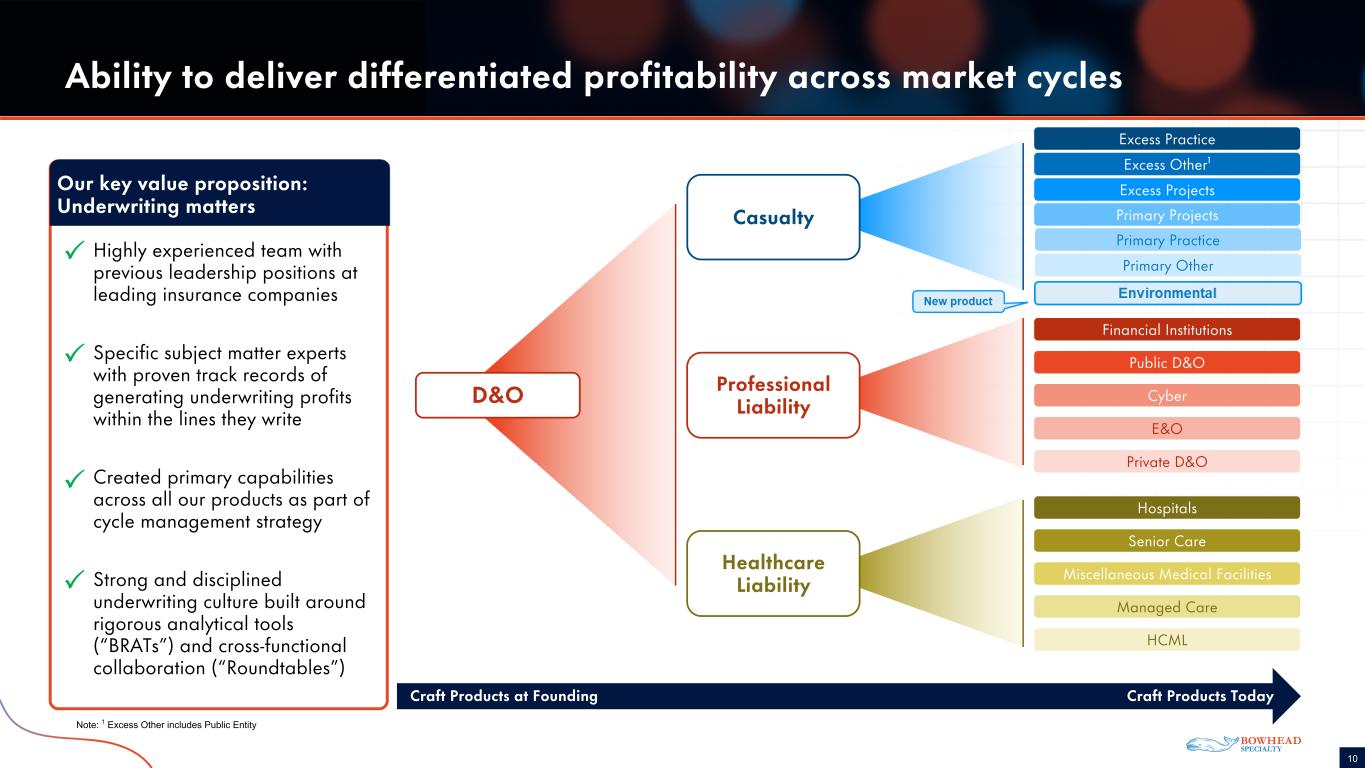
COLOR PALETTE Text 50 56 62 Title bar/ Bullets 1 23 65 ACCEN TS 1 1 23 65 80 139 252 2 0 148 255 153 212 255 3 234 71 36 247 181 167 4 164 148 31 235 225 149 5 121 26 104 229 135 213 6 83 161 209 186 217 237 Hyperlink 0 148 255 153 212 255 Followed Hyperlink 234 71 36 247 181 167 Line s 50 56 62 Highlights 1 23 65 TABL E 10 Ability to deliver differentiated profitability across market cycles Craft Products at Founding Craft Products Today Excess Practice Excess Projects Primary Practice Primary Projects Excess Other¹ Primary Other Private D&O E&O Public D&O Financial Institutions Cyber Hospitals Senior Care Managed Care HCML Miscellaneous Medical Facilities Casualty Professional Liability Healthcare Liability D&O Highly experienced team with previous leadership positions at leading insurance companies Specific subject matter experts with proven track records of generating underwriting profits within the lines they write Created primary capabilities across all our products as part of cycle management strategy Strong and disciplined underwriting culture built around rigorous analytical tools (“BRATs”) and cross-functional collaboration (“Roundtables”) Our key value proposition: Underwriting matters Note: 1 Excess Other includes Public Entity
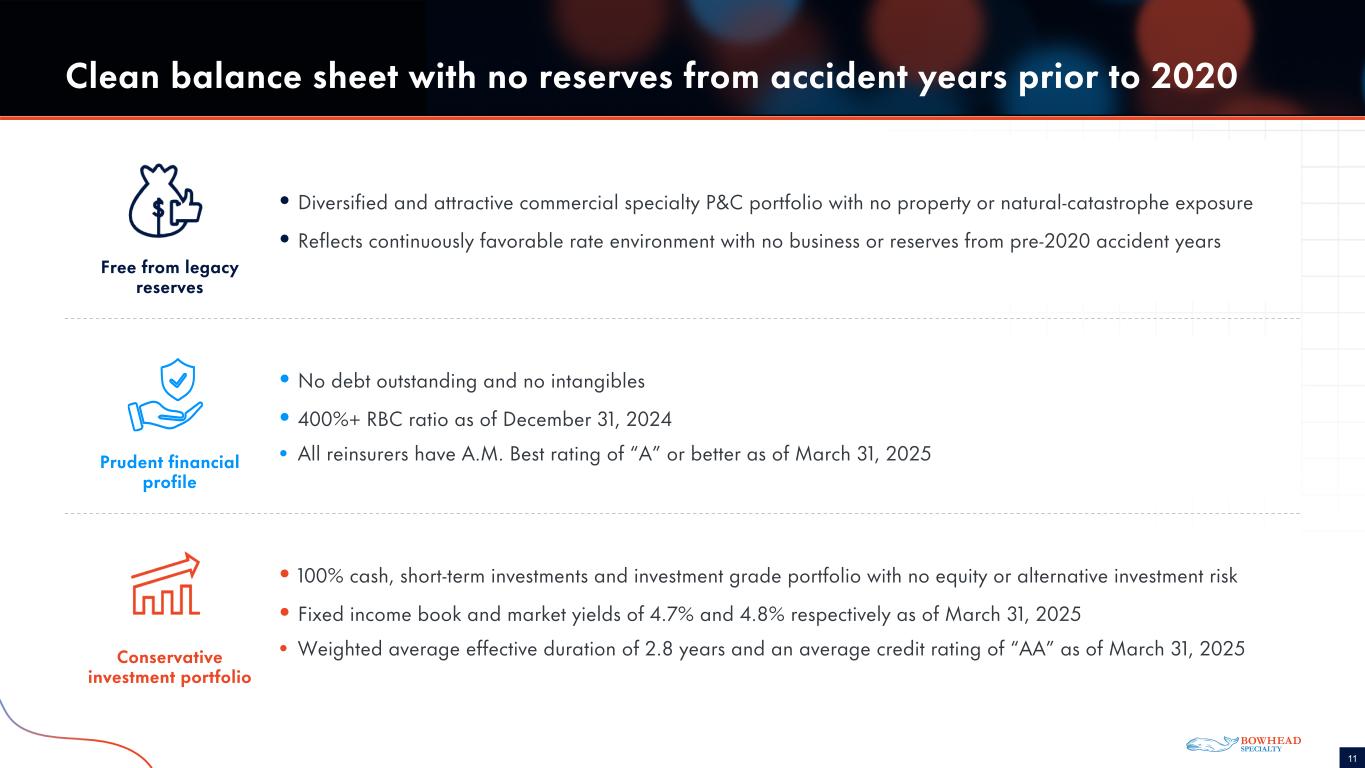
COLOR PALETTE Text 50 56 62 Title bar/ Bullets 1 23 65 ACCEN TS 1 1 23 65 80 139 252 2 0 148 255 153 212 255 3 234 71 36 247 181 167 4 164 148 31 235 225 149 5 121 26 104 229 135 213 6 83 161 209 186 217 237 Hyperlink 0 148 255 153 212 255 Followed Hyperlink 234 71 36 247 181 167 Line s 50 56 62 Highlights 1 23 65 TABL E 11 Clean balance sheet with no reserves from accident years prior to 2020 • 100% cash, short-term investments and investment grade portfolio with no equity or alternative investment risk • Fixed income book and market yields of 4.7% and 4.8% respectively as of March 31, 2025 • Weighted average effective duration of 2.8 years and an average credit rating of “AA” as of March 31, 2025Conservative investment portfolio • Diversified and attractive commercial specialty P&C portfolio with no property or natural-catastrophe exposure • Reflects continuously favorable rate environment with no business or reserves from pre-2020 accident years Free from legacy reserves • No debt outstanding and no intangibles • 400%+ RBC ratio as of December 31, 2024 • All reinsurers have A.M. Best rating of “A” or better as of March 31, 2025Prudent financial profile
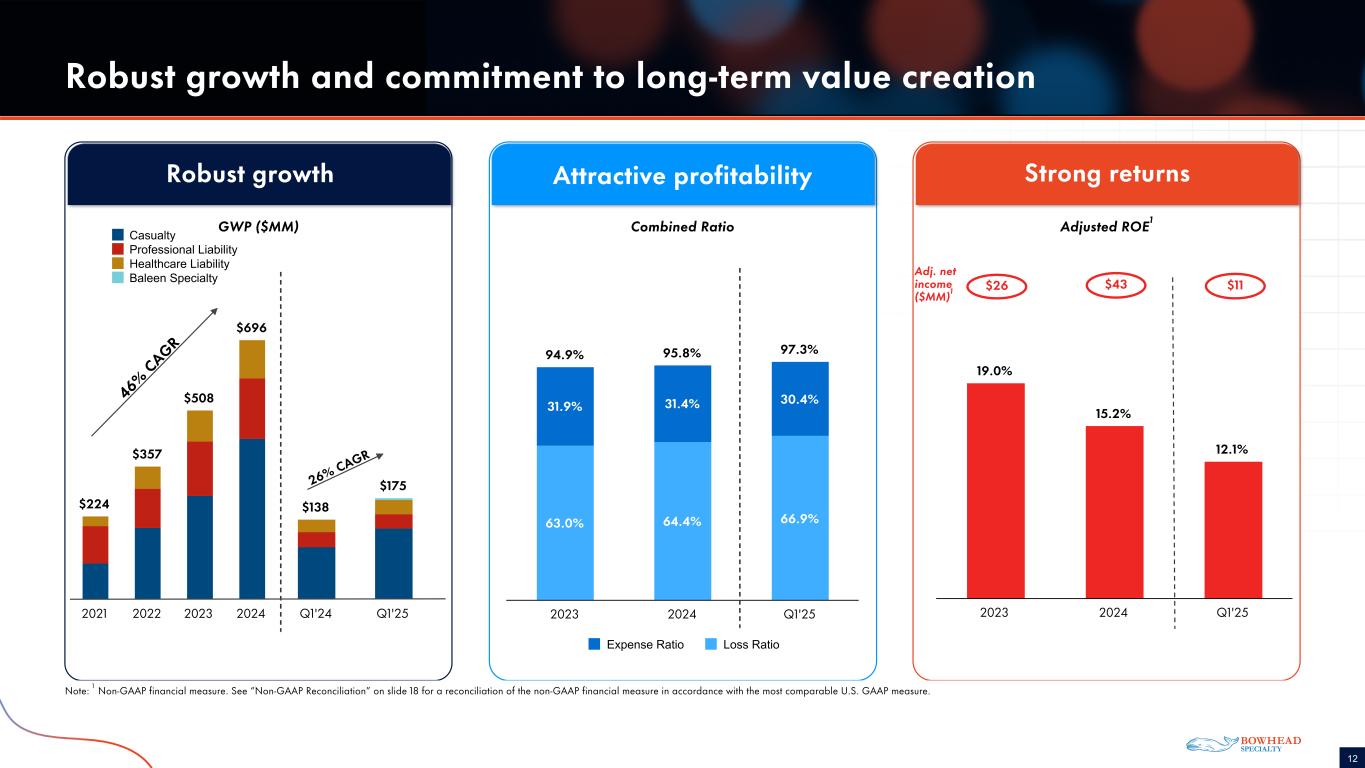
COLOR PALETTE Text 50 56 62 Title bar/ Bullets 1 23 65 ACCEN TS 1 1 23 65 80 139 252 2 0 148 255 153 212 255 3 234 71 36 247 181 167 4 164 148 31 235 225 149 5 121 26 104 229 135 213 6 83 161 209 186 217 237 Hyperlink 0 148 255 153 212 255 Followed Hyperlink 234 71 36 247 181 167 Line s 50 56 62 Highlights 1 23 65 TABL E 12 Robust growth and commitment to long-term value creation Note: 1 Non-GAAP financial measure. See “Non-GAAP Reconciliation” on slide 18 for a reconciliation of the non-GAAP financial measure in accordance with the most comparable U.S. GAAP measure. Robust growth Attractive profitability Strong returns Adjusted ROE1Combined Ratio Excess Practice Excess Projects Primary Practice Primary Projects Excess Other Primary Other Private D&O E&O Public D&O Financial Institutions Cyber Hospitals Senior Care Managed Care 94.9% 95.8% 97.3% 63.0% 64.4% 66.9% 31.9% 31.4% 30.4% Expense Ratio Loss Ratio 2023 2024 Q1'25 HCML MMF 19.0% 15.2% 12.1% 2023 2024 Q1'25 $43$26 $11 Adj. net income ($MM)1 $224 $357 $508 $696 Casualty Professional Liability Healthcare Liability Baleen Specialty 2021 2022 2023 2024 46% CAGR $138 $175 Q1'24 Q1'25 26% CAGR GWP ($MM)
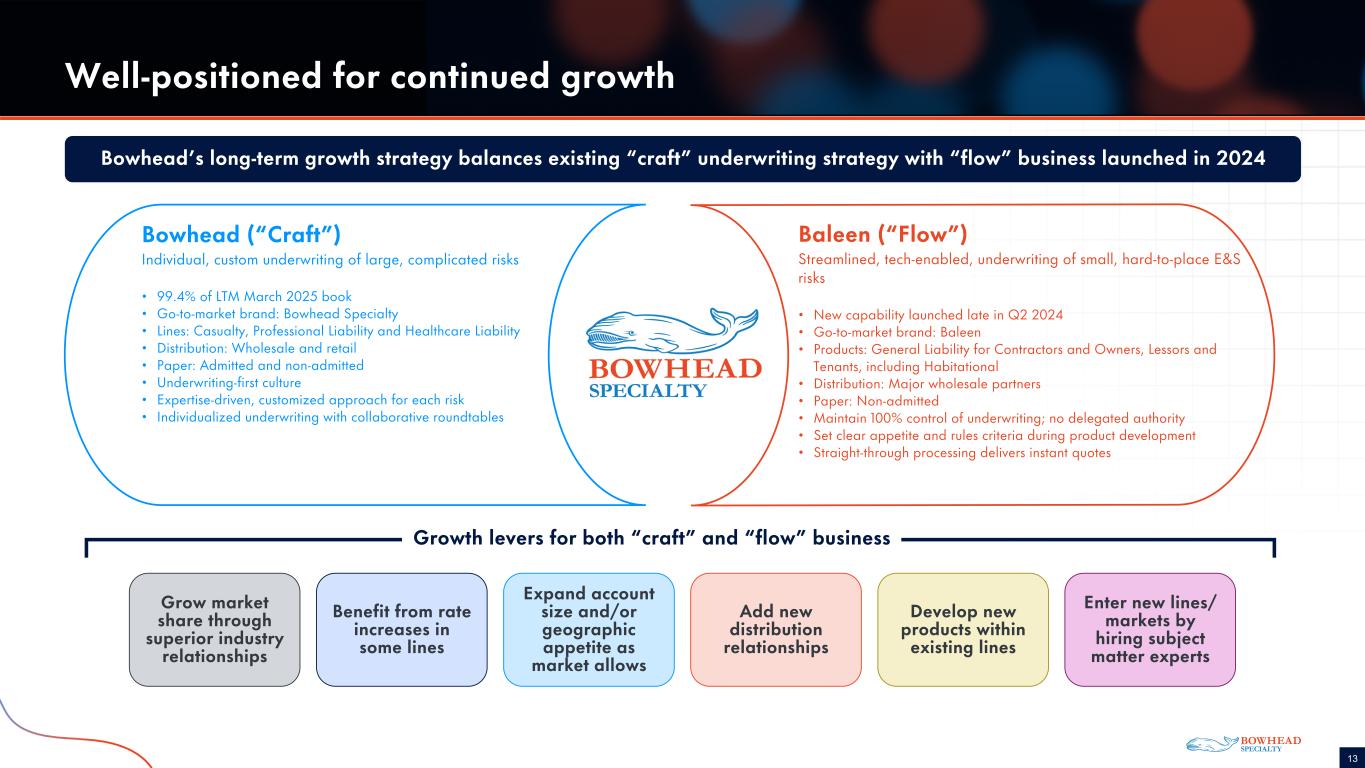
COLOR PALETTE Text 50 56 62 Title bar/ Bullets 1 23 65 ACCEN TS 1 1 23 65 80 139 252 2 0 148 255 153 212 255 3 234 71 36 247 181 167 4 164 148 31 235 225 149 5 121 26 104 229 135 213 6 83 161 209 186 217 237 Hyperlink 0 148 255 153 212 255 Followed Hyperlink 234 71 36 247 181 167 Line s 50 56 62 Highlights 1 23 65 TABL E 13 Well-positioned for continued growth Grow market share through superior industry relationships Benefit from rate increases in some lines Expand account size and/or geographic appetite as market allows Add new distribution relationships Develop new products within existing lines Enter new lines/ markets by hiring subject matter experts Growth levers for both “craft” and “flow” business Baleen (“Flow”) Streamlined, tech-enabled, underwriting of small, hard-to-place E&S risks • New capability launched late in Q2 2024 • Go-to-market brand: Baleen • Products: General Liability for Contractors and Owners, Lessors and Tenants, including Habitational • Distribution: Major wholesale partners • Paper: Non-admitted • Maintain 100% control of underwriting; no delegated authority • Set clear appetite and rules criteria during product development • Straight-through processing delivers instant quotes Bowhead (“Craft”) Individual, custom underwriting of large, complicated risks • 99.4% of LTM March 2025 book • Go-to-market brand: Bowhead Specialty • Lines: Casualty, Professional Liability and Healthcare Liability • Distribution: Wholesale and retail • Paper: Admitted and non-admitted • Underwriting-first culture • Expertise-driven, customized approach for each risk • Individualized underwriting with collaborative roundtables Bowhead’s long-term growth strategy balances existing “craft” underwriting strategy with “flow” business launched in 2024

DRAFT: 3/1/2024 Financials
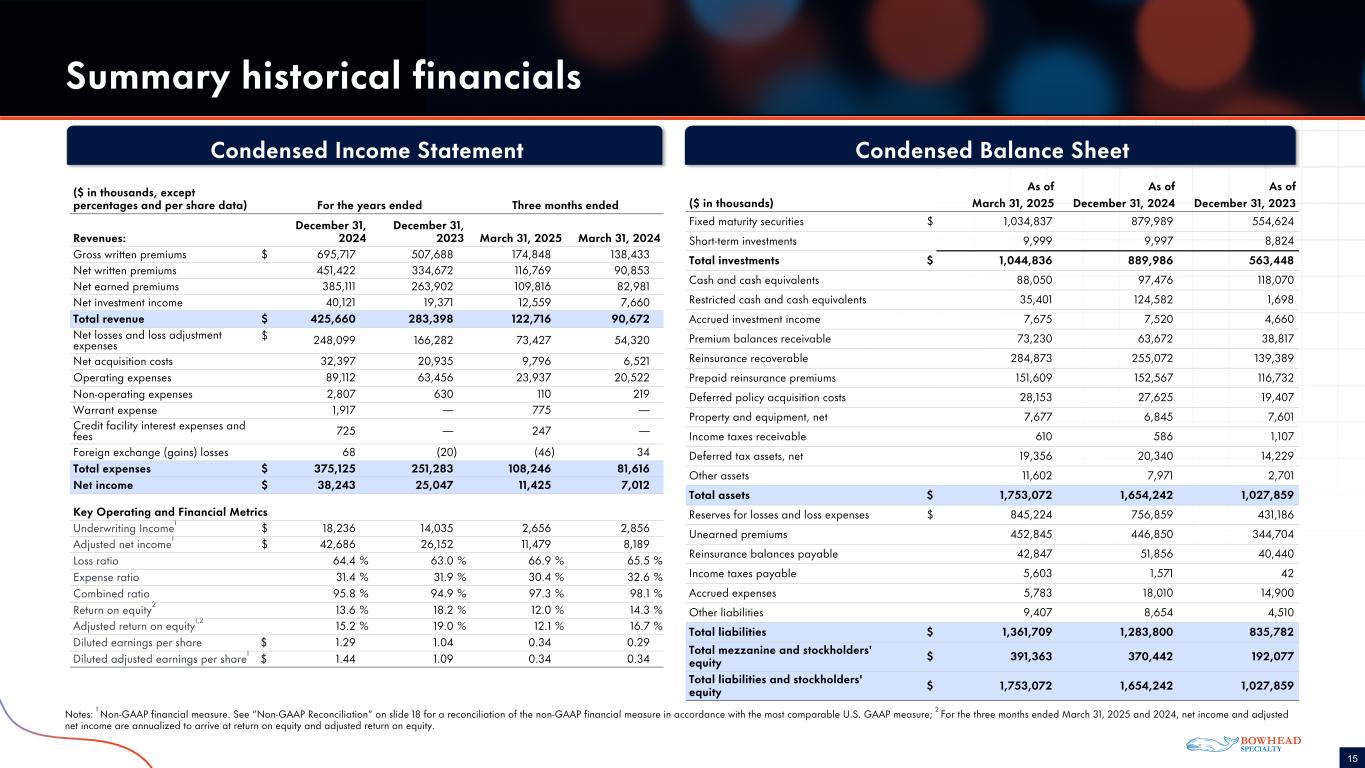
COLOR PALETTE Text 50 56 62 Title bar/ Bullets 1 23 65 ACCEN TS 1 1 23 65 80 139 252 2 0 148 255 153 212 255 3 234 71 36 247 181 167 4 164 148 31 235 225 149 5 121 26 104 229 135 213 6 83 161 209 186 217 237 Hyperlink 0 148 255 153 212 255 Followed Hyperlink 234 71 36 247 181 167 Line s 50 56 62 Highlights 1 23 65 TABL E 15 As of As of As of ($ in thousands) March 31, 2025 December 31, 2024 December 31, 2023 Fixed maturity securities $ 1,034,837 879,989 554,624 Short-term investments 9,999 9,997 8,824 Total investments $ 1,044,836 889,986 563,448 Cash and cash equivalents 88,050 97,476 118,070 Restricted cash and cash equivalents 35,401 124,582 1,698 Accrued investment income 7,675 7,520 4,660 Premium balances receivable 73,230 63,672 38,817 Reinsurance recoverable 284,873 255,072 139,389 Prepaid reinsurance premiums 151,609 152,567 116,732 Deferred policy acquisition costs 28,153 27,625 19,407 Property and equipment, net 7,677 6,845 7,601 Income taxes receivable 610 586 1,107 Deferred tax assets, net 19,356 20,340 14,229 Other assets 11,602 7,971 2,701 Total assets $ 1,753,072 1,654,242 1,027,859 Reserves for losses and loss expenses $ 845,224 756,859 431,186 Unearned premiums 452,845 446,850 344,704 Reinsurance balances payable 42,847 51,856 40,440 Income taxes payable 5,603 1,571 42 Accrued expenses 5,783 18,010 14,900 Other liabilities 9,407 8,654 4,510 Total liabilities $ 1,361,709 1,283,800 835,782 Total mezzanine and stockholders' equity $ 391,363 370,442 192,077 Total liabilities and stockholders' equity $ 1,753,072 1,654,242 1,027,859 Summary historical financials Condensed Income Statement Condensed Balance Sheet ($ in thousands, except percentages and per share data) For the years ended Three months ended Revenues: December 31, 2024 December 31, 2023 March 31, 2025 March 31, 2024 Gross written premiums $ 695,717 507,688 174,848 138,433 Net written premiums 451,422 334,672 116,769 90,853 Net earned premiums 385,111 263,902 109,816 82,981 Net investment income 40,121 19,371 12,559 7,660 Total revenue $ 425,660 283,398 122,716 90,672 Net losses and loss adjustment expenses $ 248,099 166,282 73,427 54,320 Net acquisition costs 32,397 20,935 9,796 6,521 Operating expenses 89,112 63,456 23,937 20,522 Non-operating expenses 2,807 630 110 219 Warrant expense 1,917 — 775 — Credit facility interest expenses and fees 725 — 247 — Foreign exchange (gains) losses 68 (20) (46) 34 Total expenses $ 375,125 251,283 108,246 81,616 Net income $ 38,243 25,047 11,425 7,012 Key Operating and Financial Metrics Underwriting Income1 $ 18,236 14,035 2,656 2,856 Adjusted net income1 $ 42,686 26,152 11,479 8,189 Loss ratio 64.4 % 63.0 % 66.9 % 65.5 % Expense ratio 31.4 % 31.9 % 30.4 % 32.6 % Combined ratio 95.8 % 94.9 % 97.3 % 98.1 % Return on equity2 13.6 % 18.2 % 12.0 % 14.3 % Adjusted return on equity1,2 15.2 % 19.0 % 12.1 % 16.7 % Diluted earnings per share $ 1.29 1.04 0.34 0.29 Diluted adjusted earnings per share1 $ 1.44 1.09 0.34 0.34 Notes: 1 Non-GAAP financial measure. See “Non-GAAP Reconciliation” on slide 18 for a reconciliation of the non-GAAP financial measure in accordance with the most comparable U.S. GAAP measure; 2 For the three months ended March 31, 2025 and 2024, net income and adjusted net income are annualized to arrive at return on equity and adjusted return on equity.

DRAFT: 3/1/2024 Appendix
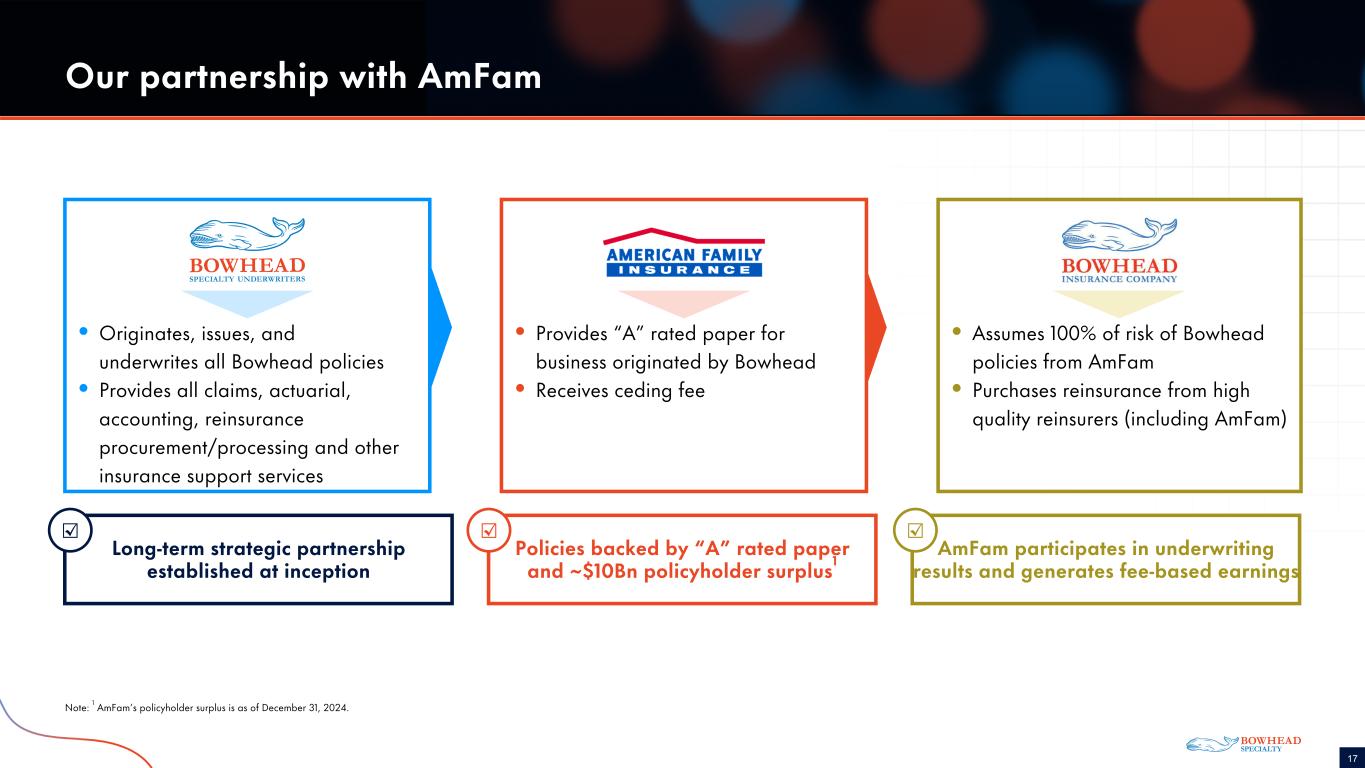
COLOR PALETTE Text 50 56 62 Title bar/ Bullets 1 23 65 ACCEN TS 1 1 23 65 80 139 252 2 0 148 255 153 212 255 3 234 71 36 247 181 167 4 164 148 31 235 225 149 5 121 26 104 229 135 213 6 83 161 209 186 217 237 Hyperlink 0 148 255 153 212 255 Followed Hyperlink 234 71 36 247 181 167 Line s 50 56 62 Highlights 1 23 65 TABL E 17 Long-term strategic partnership established at inception AmFam participates in underwriting results and generates fee-based earnings Policies backed by “A” rated paper and ~$10Bn policyholder surplus1 Our partnership with AmFam Note: 1 AmFam’s policyholder surplus is as of December 31, 2024. ☑ ☑☑ • Originates, issues, and underwrites all Bowhead policies • Provides all claims, actuarial, accounting, reinsurance procurement/processing and other insurance support services • Provides “A” rated paper for business originated by Bowhead • Receives ceding fee • Assumes 100% of risk of Bowhead policies from AmFam • Purchases reinsurance from high quality reinsurers (including AmFam)
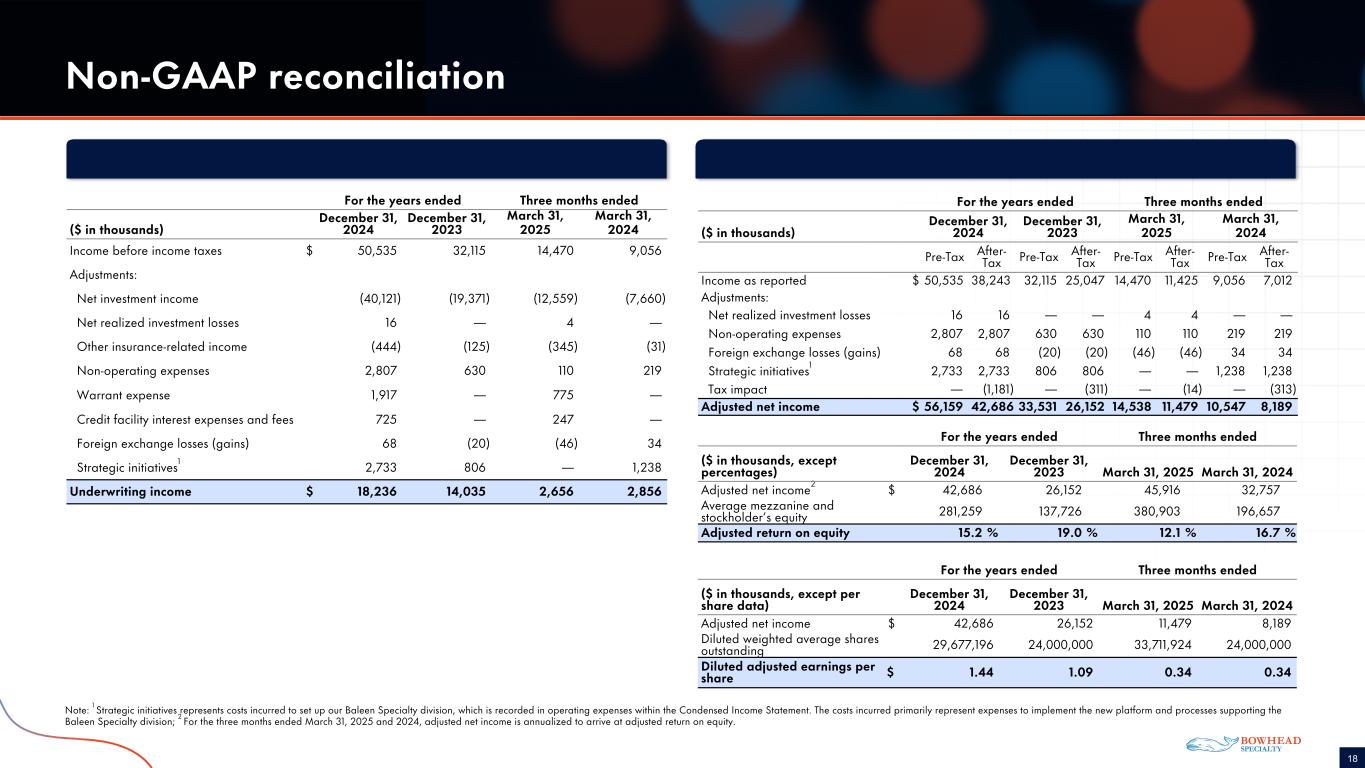
COLOR PALETTE Text 50 56 62 Title bar/ Bullets 1 23 65 ACCEN TS 1 1 23 65 80 139 252 2 0 148 255 153 212 255 3 234 71 36 247 181 167 4 164 148 31 235 225 149 5 121 26 104 229 135 213 6 83 161 209 186 217 237 Hyperlink 0 148 255 153 212 255 Followed Hyperlink 234 71 36 247 181 167 Line s 50 56 62 Highlights 1 23 65 TABL E 18 Non-GAAP reconciliation For the years ended Three months ended ($ in thousands, except percentages) December 31, 2024 December 31, 2023 March 31, 2025 March 31, 2024 Adjusted net income2 $ 42,686 26,152 45,916 32,757 Average mezzanine and stockholder’s equity 281,259 137,726 380,903 196,657 Adjusted return on equity 15.2 % 19.0 % 12.1 % 16.7 % For the years ended Three months ended ($ in thousands) December 31, 2024 December 31, 2023 March 31, 2025 March 31, 2024 Pre-Tax After- Tax Pre-Tax After- Tax Pre-Tax After- Tax Pre-Tax After- Tax Income as reported $ 50,535 38,243 32,115 25,047 14,470 11,425 9,056 7,012 Adjustments: Net realized investment losses 16 16 — — 4 4 — — Non-operating expenses 2,807 2,807 630 630 110 110 219 219 Foreign exchange losses (gains) 68 68 (20) (20) (46) (46) 34 34 Strategic initiatives1 2,733 2,733 806 806 — — 1,238 1,238 Tax impact — (1,181) — (311) — (14) — (313) Adjusted net income $ 56,159 42,686 33,531 26,152 14,538 11,479 10,547 8,189 For the years ended Three months ended ($ in thousands) December 31, 2024 December 31, 2023 March 31, 2025 March 31, 2024 Income before income taxes $ 50,535 32,115 14,470 9,056 Adjustments: Net investment income (40,121) (19,371) (12,559) (7,660) Net realized investment losses 16 — 4 — Other insurance-related income (444) (125) (345) (31) Non-operating expenses 2,807 630 110 219 Warrant expense 1,917 — 775 — Credit facility interest expenses and fees 725 — 247 — Foreign exchange losses (gains) 68 (20) (46) 34 Strategic initiatives1 2,733 806 — 1,238 Underwriting income $ 18,236 14,035 2,656 2,856 Note: 1 Strategic initiatives represents costs incurred to set up our Baleen Specialty division, which is recorded in operating expenses within the Condensed Income Statement. The costs incurred primarily represent expenses to implement the new platform and processes supporting the Baleen Specialty division; 2 For the three months ended March 31, 2025 and 2024, adjusted net income is annualized to arrive at adjusted return on equity. For the years ended Three months ended ($ in thousands, except per share data) December 31, 2024 December 31, 2023 March 31, 2025 March 31, 2024 Adjusted net income $ 42,686 26,152 11,479 8,189 Diluted weighted average shares outstanding 29,677,196 24,000,000 33,711,924 24,000,000 Diluted adjusted earnings per share $ 1.44 1.09 0.34 0.34